


S&P 500(INDEXSP:.INX), market, true, recession, rates, debt

12-26-2017
This is a snippet from a CML Pro dossier published on 12-26-2017.
Preface
Hello, all. This is Ophir writing. The time has come for our "State of the Market" bi-annual report as we head into 2018.
Let's look at what's true, what's not true, what people think is true but is not, and what people think is not true but is.
Finally, we must discuss the new tax law that will go into effect in 2018 and how it could effectthe S&P 500 (INDEXSP:.INX).
CONTENT
A quick note here on some great Twitter follows from where some of these charts come:
@Callum_Thomas
@ukarlewitz
@jessefelder
@ReformedBroker
THINGS THAT ARE TRUE
We will discuss what is not true in the following section (which may be the most fascinating part), but for now, let's start with what is true.
These things are true:
1. Valuations are stretched, now at levels not seen since the dot com era.
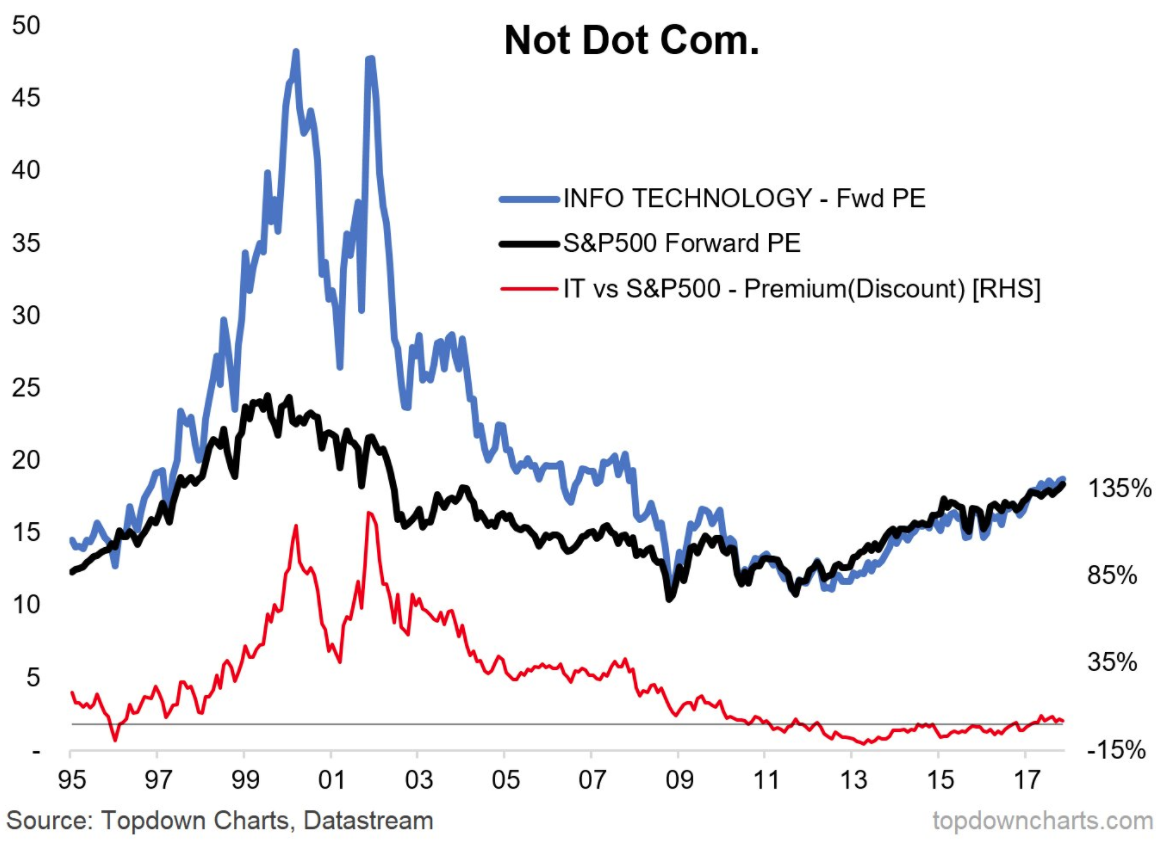
The black line is the S&P 500 P/E ratio using expectations for next year's earnings.
2. While valuations are stretched, they are nowhere near the dot com bubble. In fact, valuations today as measured by various calculations of the price to earnings ratio (P/E), are further from the dot com bubble highs than they are from the historical norms.
Same chart, the blue line was the P/E ratio for technology. We can see that there was nothing like dot com bubble in our history, and there still has not been.
-- Psychology has changed
3. In 2017, the S&P 500 essentially skipped its seasonality bump in fall -- we usually see a dip, and this year, we basically didn't.
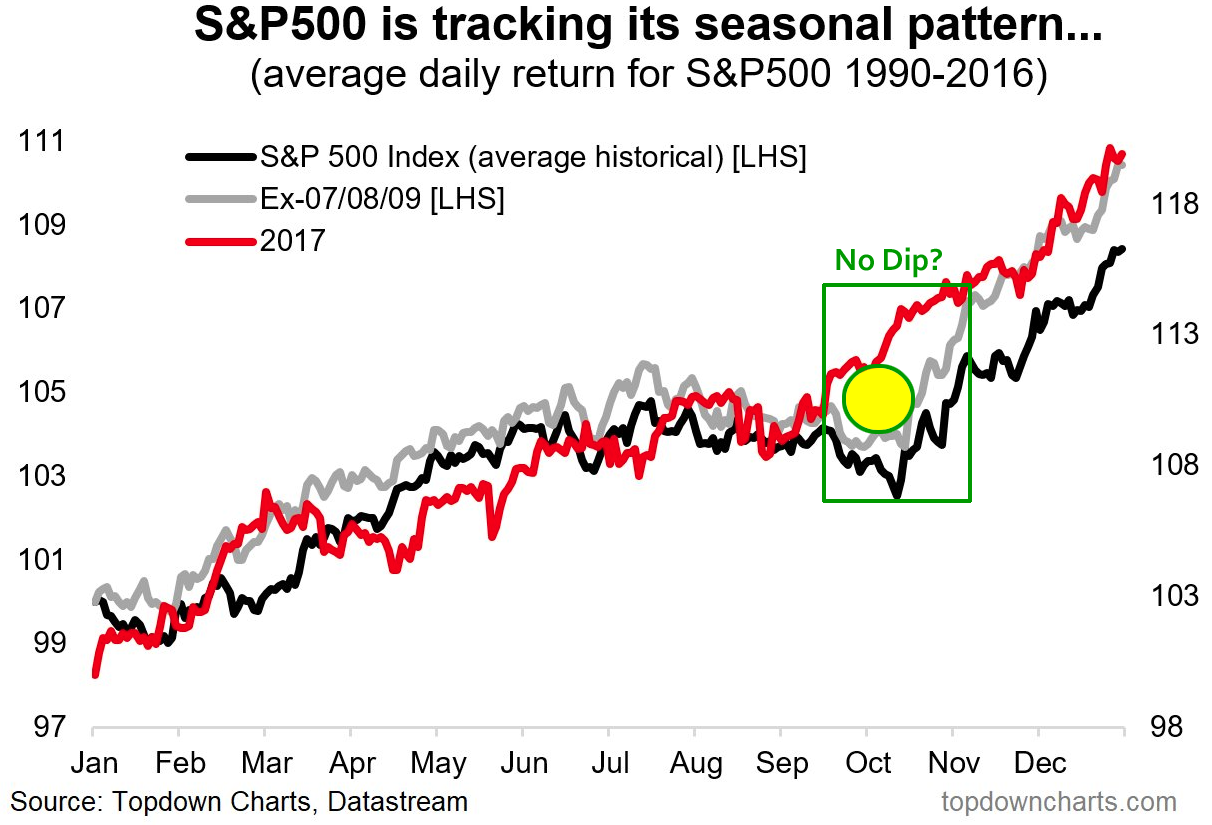
The gray line is our baseline, which is the S&P 500 seasonality trends excluding the Great Recession in 2007-2008. By the end of the year, the seasonality trends lay right on top of each other, but there was no dip in the October period. This has created a change in psychology. Let's look at that.
4. The VIX, which measures the price people are paying for downside protection, has been so remarkably depressed, that it takes charts to even describe it.
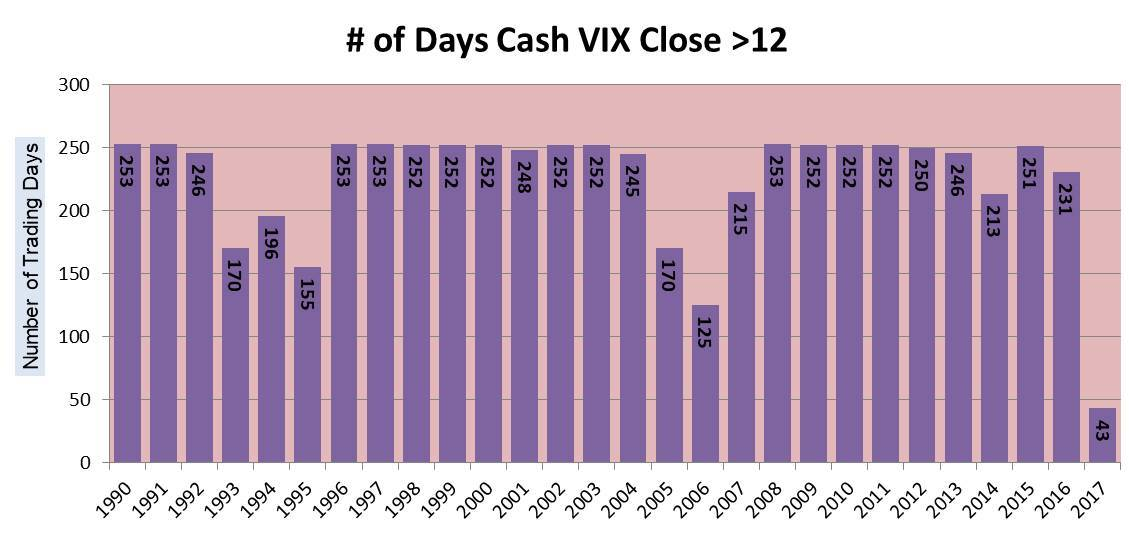
The VIX has only been above the 12% level for 43 days in 2017, no other year over the last 27 years has even seen that number below 125. This is totally unprecedented with respect to the risk malaise the market is in.
There is simply no "fear" in this market and that has created another phenomenon.
5. Buying of intraday dips has not been this aggressive and frequent since 1995.
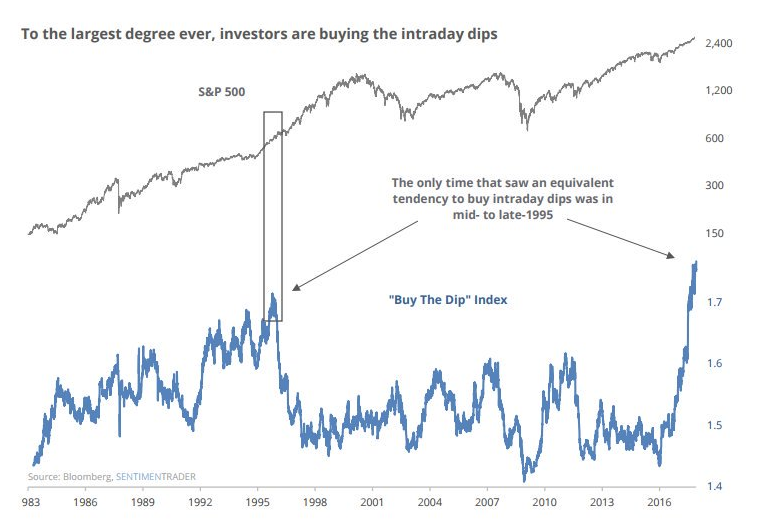
With "fear" at record lows, dips are seen as buying opportunities -- more so than we have seen in more than three-decades. This is a stunning chart, if we just take a second to digest it.
6. No recession over the last 50 years has ever started with the federal Funds interest rate below 4%. The current federal funds rate is 1.5%. The Federal Reserve signaled it will raise rates to 2% in 2018, 2.5% in 2019 and 3% in 2020.
Here is a chart of the effective Fed Funds rate -- the gray shaded areas represent periods of recession.
We can also plot the S&P 500 (orange) on the same chart as the Fed Funds rate (blue):
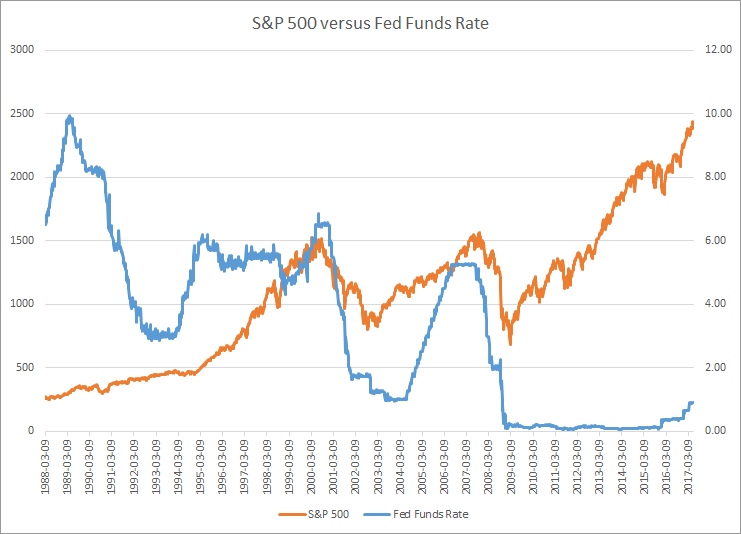
We can see the last two massive downturns coincided with the recessions, which were forward indicated by interest rates.
Finally, we can look at interest rates over the last several years to get a cleaner picture of where we are now.
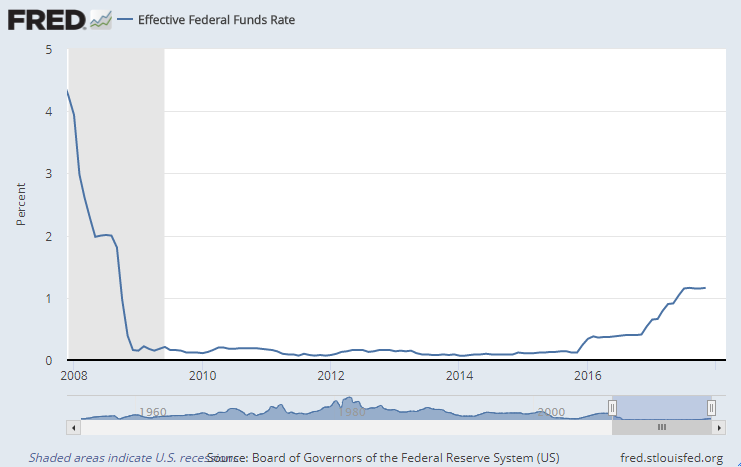
We can see that rates are certainly rising. But, we can also see that with a fed funds rate hovering around 1.5%, we are still in a historically low interest rate environment.
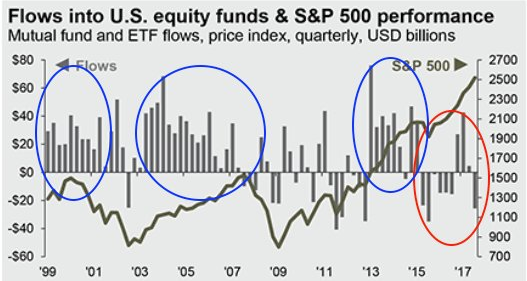
7. The flow of money into U.S. equity funds has been choppy -- and the last time it was this choppy was the Great Recession.
THINGS THAT ARE NOT TRUE
While we can see many phenomena that are true, the "headline frenzy" that is designed to get web clicks has created a wave of garbage information that is totally, empirically, and inarguably, false.
1. Not true: Debt levels are at catastrophic levels
On August 12th, 2017, the Washington Post wrote: Consumer debt is at a record high. Haven't we learned?
And, I kid you not, this is a direct quote from that article:
Outstanding consumer revolving debt - mostly credit card debt - hit an all-time peak of $1.021 trillion in June, according to the Federal Reserve.
This should be a scary statistic. The last time the debt level was nearly this high was in 2008, when the U.S. economy was mired in a recession.
While credit card debt is at all-time highs, the narrative surrounding it is false. And when we say false, we mean that empirically, not as in an argument over an opinion. Here are three charts that people who don't understand finance, markets or economics will never look at, or understand, but that's how they get web page clicks.
Now, before we show you these three charts, just for a second, pause, and talk to yourself -- that voice in your head that always answers back. Based on what you have read, heard, or just learned above, what is your opinion of debt levels for consumers in the United States?
This is one of the most important practices as an investor -- to note a bias, to test that bias with data that counters it, and then to re-test your opinion.
If we can eliminate (or alleviate) cognitive dissonance from our investing, at the very least we will have less stress, and at the very most, we will be more knowledgeable and profitable.
Here is a chart of household financial obligations relative to disposable income.
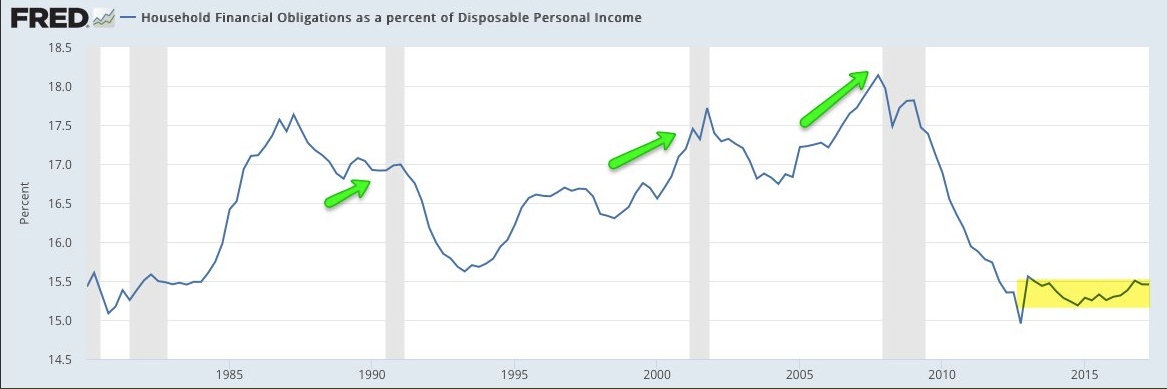
This is also called "debt service." The data here shows, empirically, that while household debt may be at highs, the amount of debt we hold relative to our personal income is not only low, it has been consistently low for several years, and is at levels not seen since the early 1980s.
But, while the narrative of growing debt has been bungled, note that back in 1983, even with household financial obligations relative to disposable income at low levels, we did hit a recession.
Yet more evidence that personal debt has not become an issue can be seen in delinquencies. Here is a chart of installment loan delinquency over the last 15-years.
The ABA report defines a delinquency as a late payment that is 30 days or more overdue.
3. Not true: Auto loans are a disaster:
And while we're at it, no, there is no auto loan disaster looming. This is from the ABA (our emphasis is added):
4. Not true: Mortgage debt is exploding again.
Oh, here we go again. Let's just look at a chart and be done with this one.
Mortgage debt is rising nominally, but is at four decade lows to personal income.
So, while debt is very high in nominal terms, because interest rates are so low, it is not having a great impact on our personal wealth. But, heed the warning, if interest rates rise, all of a sudden all of those charts could swing in a different direction.
5. Not true: There is no job growth
But, even though jobless claims are at 40-year lows, it's actually lower than it appears. While jobless claims are at their lowest level since 1973, the US population has grown from 210 million to 326 million.
Here's a chart of jobless claims (blue) together with US population (red):
Suffice it so say, joblessness is not the issue. And while we're at it, neither are real wages.
6. Not true: real wages aren't rising.
Wages, adjusted for inflation, are in fact at all-time historic highs for American workers.
The bullish argument is that the economy is healthy, the American worker is healthy, and so a recession is nowhere to be found.
The bearish argument is that unemployment is at a cyclical low, it will go higher, and the current rising wages with tightened labor market will make it more difficult for companies to earning outsized profits, and that will cut corporate profits and the market will drop.
Now it's time to talk about the new tax law.
NEW TAX LAW - WHAT DOES IT MEAN OR WHY DOES IT MATTER?
We don't debate politics here, we look at facts and in that vein we must address the reality that one of the largest tax reformations (cuts) becomes a new law in 2018 and the impact on the market in the immediate-term could be bullish.
The tax bill contains a 8% one-time tax on illiquid assets and a 15.5% tax on cash and cash equivalents held overseas. While the government had previously waited until a company repatriated cash to levy a 35% tax, it will now impose a 15.5% tax on cash earnings.
Meanwhile, the corporate tax rate cut could push companies to invest in new data centers, cloud services and other technology. That narrative is also backed by the increased deductions for capital spending in the new tax law.
Starting next year companies will pay 10.5% or 13.125% on half of the income from subsidiaries outside the U.S. They will pay taxes of 10.5% or 13.125% -- a discount to the new 21% corporate tax rate.
While the focus has been on mega tech and all that overseas cash -- the reality is that will likely be spent on stock buybacks or dividends and could have an one-time effect.
Apple, for example, had more than $250 billion in overseas cash at the end of last quarter. Instead of paying the old 35% corporate rate to bring that back to the U.S., Apple would now pay just 15.5%. That's the difference between $87.5 billion and $38.8 billion. Here comes Apple's new mega stock buyback plan.
But, Silicon Valley generally pays lower taxes than energy companies, telecoms and industrials, and will benefit less from the reduction in the corporate tax rate from 35% to 21%.
Or, said differently, the media can stop focusing on tech and turn to the rest of our economy.
Here is a snippet from a Wall Street Journal article:
WHAT NOW?
At Capital Market Laboratories we focus on the future -- not as in the next year, or even 3-years, but as in the next decade, or even two decades. We focus on the world changing trends that will occur, irrespective of recessions, booms and busts, interest rates, even wars.
It's the companies that power these trends, that are the pick-axes to the gold rush, that we have identified as our Top Picks. Let volatility happen, and markets crash. Let recessions happen, and economies spasm. That's natural -- and it will happen.
We are focused on how the world is changing, and in that space, we have confidence that nothing can stop these trends.
We are Capital Market Laboratories. Our research sits next to Goldman Sachs, JP Morgan, Barclays, Morgan Stanley and every other multi billion dollar institution as a member of the famed Thomson Reuters First Call. But while those people pay upwards of $2,000 a month on their live terminals, we are the anti-institution and are breaking the information asymmetry.
The precious few thematic top picks for 2017, research dossiers, and alerts are available for a limited time at a 80% discount for $29/mo. Join Us: Discover the undiscovered companies that will power technology's future.
Thanks for reading, friends.
Please read the legal disclaimers below and as always, remember, CML Pro does not make recommendations or solicitations for the sale or purchase of any security ever. We are not licensed to do so, and wouldn't do it even if we were. We share research and provide you the power to be knowledgeable to make your own decisions.
Legal
The information contained on this site is provided for general informational purposes, as a convenience to the readers. The materials are not a substitute for obtaining professional advice from a qualified person, firm or corporation. Consult the appropriate professional advisor for more complete and current information. Capital Market Laboratories ("The Company") does not engage in rendering any legal or professional services by placing these general informational materials on this website.
The Company specifically disclaims any liability, whether based in contract, tort, strict liability or otherwise, for any direct, indirect, incidental, consequential, or special damages arising out of or in any way connected with access to or use of the site, even if I have been advised of the possibility of such damages, including liability in connection with mistakes or omissions in, or delays in transmission of, information to or from the user, interruptions in telecommunications connections to the site or viruses.
The Company makes no representations or warranties about the accuracy or completeness of the information contained on this website. Any links provided to other server sites are offered as a matter of convenience and in no way are meant to imply that The Company endorses, sponsors, promotes or is affiliated with the owners of or participants in those sites, or endorse any information contained on those sites, unless expressly stated.
Truth and Lies: State of the Market for 2018
12-26-2017
This is a snippet from a CML Pro dossier published on 12-26-2017.
Preface
Hello, all. This is Ophir writing. The time has come for our "State of the Market" bi-annual report as we head into 2018.
Let's look at what's true, what's not true, what people think is true but is not, and what people think is not true but is.
Finally, we must discuss the new tax law that will go into effect in 2018 and how it could effectthe S&P 500 (INDEXSP:.INX).
CONTENT
A quick note here on some great Twitter follows from where some of these charts come:
@Callum_Thomas
@ukarlewitz
@jessefelder
@ReformedBroker
THINGS THAT ARE TRUE
We will discuss what is not true in the following section (which may be the most fascinating part), but for now, let's start with what is true.
These things are true:
1. Valuations are stretched, now at levels not seen since the dot com era.
The black line is the S&P 500 P/E ratio using expectations for next year's earnings.
2. While valuations are stretched, they are nowhere near the dot com bubble. In fact, valuations today as measured by various calculations of the price to earnings ratio (P/E), are further from the dot com bubble highs than they are from the historical norms.
Same chart, the blue line was the P/E ratio for technology. We can see that there was nothing like dot com bubble in our history, and there still has not been.
-- Psychology has changed
3. In 2017, the S&P 500 essentially skipped its seasonality bump in fall -- we usually see a dip, and this year, we basically didn't.
The gray line is our baseline, which is the S&P 500 seasonality trends excluding the Great Recession in 2007-2008. By the end of the year, the seasonality trends lay right on top of each other, but there was no dip in the October period. This has created a change in psychology. Let's look at that.
4. The VIX, which measures the price people are paying for downside protection, has been so remarkably depressed, that it takes charts to even describe it.
The VIX has only been above the 12% level for 43 days in 2017, no other year over the last 27 years has even seen that number below 125. This is totally unprecedented with respect to the risk malaise the market is in.
There is simply no "fear" in this market and that has created another phenomenon.
5. Buying of intraday dips has not been this aggressive and frequent since 1995.
With "fear" at record lows, dips are seen as buying opportunities -- more so than we have seen in more than three-decades. This is a stunning chart, if we just take a second to digest it.
6. No recession over the last 50 years has ever started with the federal Funds interest rate below 4%. The current federal funds rate is 1.5%. The Federal Reserve signaled it will raise rates to 2% in 2018, 2.5% in 2019 and 3% in 2020.
Here is a chart of the effective Fed Funds rate -- the gray shaded areas represent periods of recession.
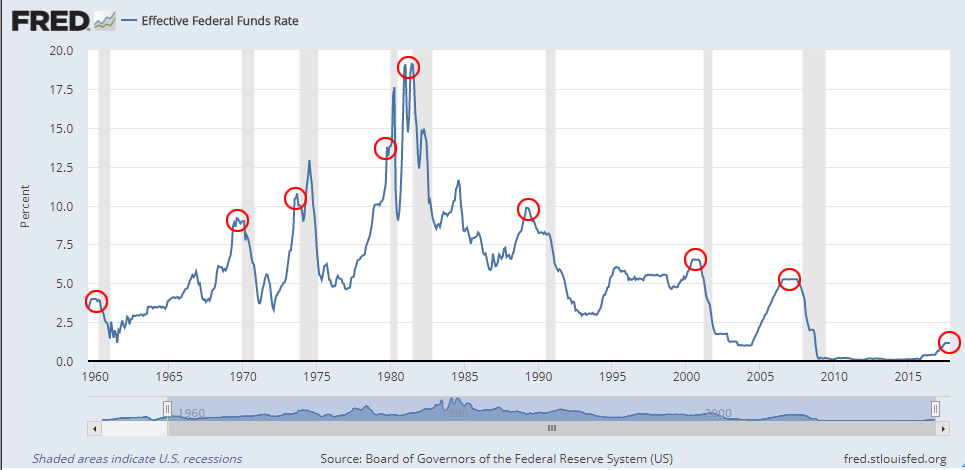
We can also plot the S&P 500 (orange) on the same chart as the Fed Funds rate (blue):
We can see the last two massive downturns coincided with the recessions, which were forward indicated by interest rates.
Finally, we can look at interest rates over the last several years to get a cleaner picture of where we are now.
We can see that rates are certainly rising. But, we can also see that with a fed funds rate hovering around 1.5%, we are still in a historically low interest rate environment.
7. The flow of money into U.S. equity funds has been choppy -- and the last time it was this choppy was the Great Recession.
THINGS THAT ARE NOT TRUE
While we can see many phenomena that are true, the "headline frenzy" that is designed to get web clicks has created a wave of garbage information that is totally, empirically, and inarguably, false.
1. Not true: Debt levels are at catastrophic levels
On August 12th, 2017, the Washington Post wrote: Consumer debt is at a record high. Haven't we learned?
And, I kid you not, this is a direct quote from that article:
Outstanding consumer revolving debt - mostly credit card debt - hit an all-time peak of $1.021 trillion in June, according to the Federal Reserve.
This should be a scary statistic. The last time the debt level was nearly this high was in 2008, when the U.S. economy was mired in a recession.
While credit card debt is at all-time highs, the narrative surrounding it is false. And when we say false, we mean that empirically, not as in an argument over an opinion. Here are three charts that people who don't understand finance, markets or economics will never look at, or understand, but that's how they get web page clicks.
Now, before we show you these three charts, just for a second, pause, and talk to yourself -- that voice in your head that always answers back. Based on what you have read, heard, or just learned above, what is your opinion of debt levels for consumers in the United States?
This is one of the most important practices as an investor -- to note a bias, to test that bias with data that counters it, and then to re-test your opinion.
If we can eliminate (or alleviate) cognitive dissonance from our investing, at the very least we will have less stress, and at the very most, we will be more knowledgeable and profitable.
Here is a chart of household financial obligations relative to disposable income.
This is also called "debt service." The data here shows, empirically, that while household debt may be at highs, the amount of debt we hold relative to our personal income is not only low, it has been consistently low for several years, and is at levels not seen since the early 1980s.
But, while the narrative of growing debt has been bungled, note that back in 1983, even with household financial obligations relative to disposable income at low levels, we did hit a recession.
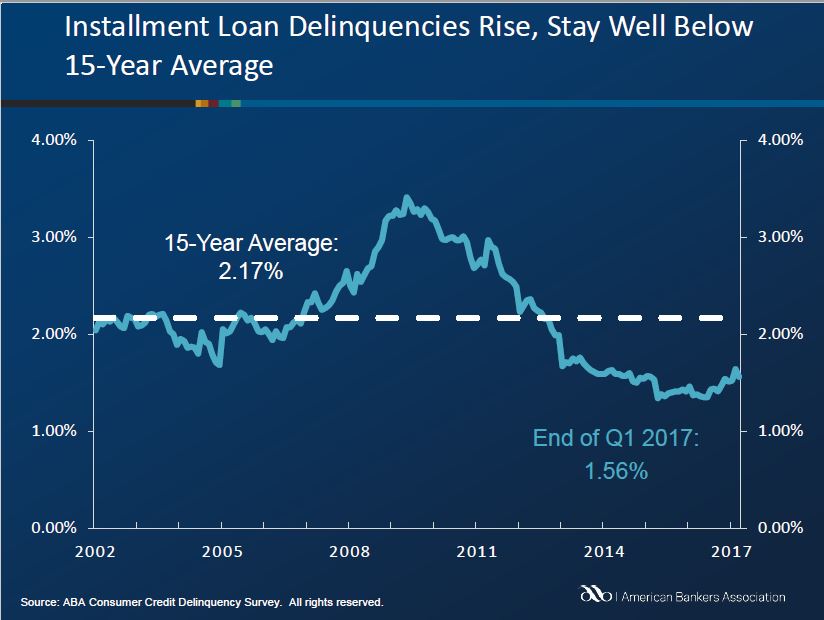
Yet more evidence that personal debt has not become an issue can be seen in delinquencies. Here is a chart of installment loan delinquency over the last 15-years.
The ABA report defines a delinquency as a late payment that is 30 days or more overdue.
3. Not true: Auto loans are a disaster:
And while we're at it, no, there is no auto loan disaster looming. This is from the ABA (our emphasis is added):
Delinquencies in indirect auto loans (those arranged through a third party such as an auto dealer) rose 8 basis points to 1.83 percent of all accounts, but remain well below their 15-year average of 2.20 percent.
Delinquencies in direct auto loans (those arranged directly through a bank) rose 9 basis points to 1.03 percent of all accounts, remaining well under their 15-year average of 1.57 percent.
Delinquencies in direct auto loans (those arranged directly through a bank) rose 9 basis points to 1.03 percent of all accounts, remaining well under their 15-year average of 1.57 percent.
4. Not true: Mortgage debt is exploding again.
Oh, here we go again. Let's just look at a chart and be done with this one.
Mortgage debt service payments as a Percent of Disposable Income
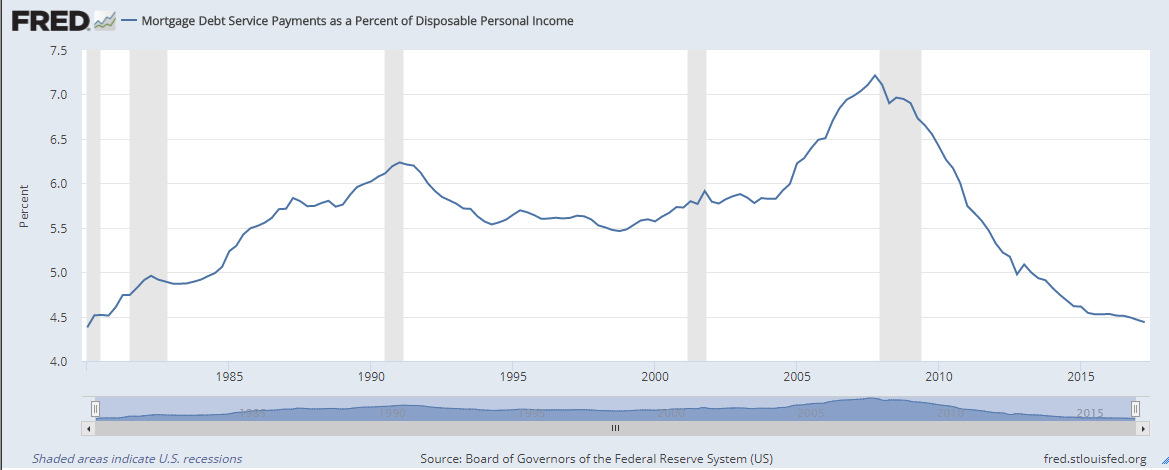
Mortgage debt is rising nominally, but is at four decade lows to personal income.
So, while debt is very high in nominal terms, because interest rates are so low, it is not having a great impact on our personal wealth. But, heed the warning, if interest rates rise, all of a sudden all of those charts could swing in a different direction.
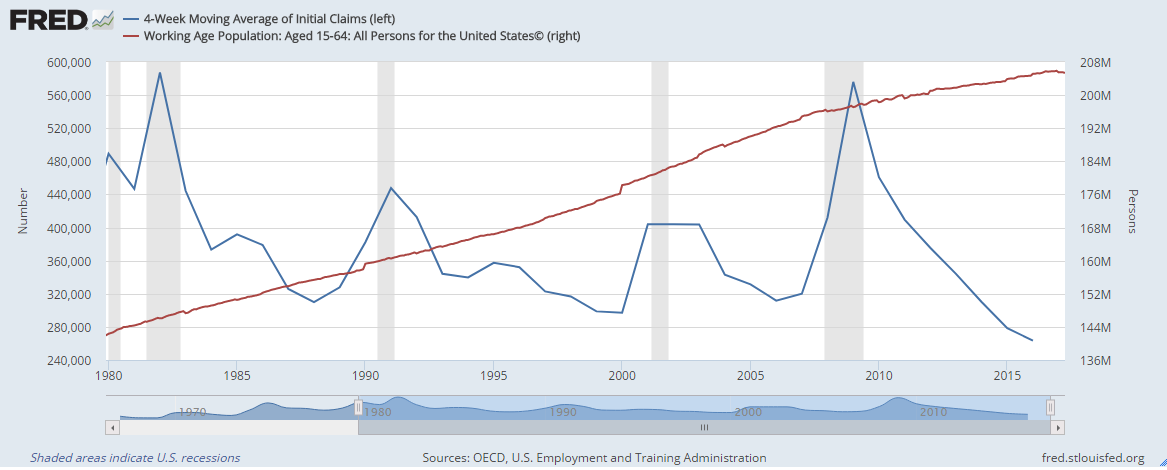
5. Not true: There is no job growth
4-week Moving Average of Initial Jobless Claims
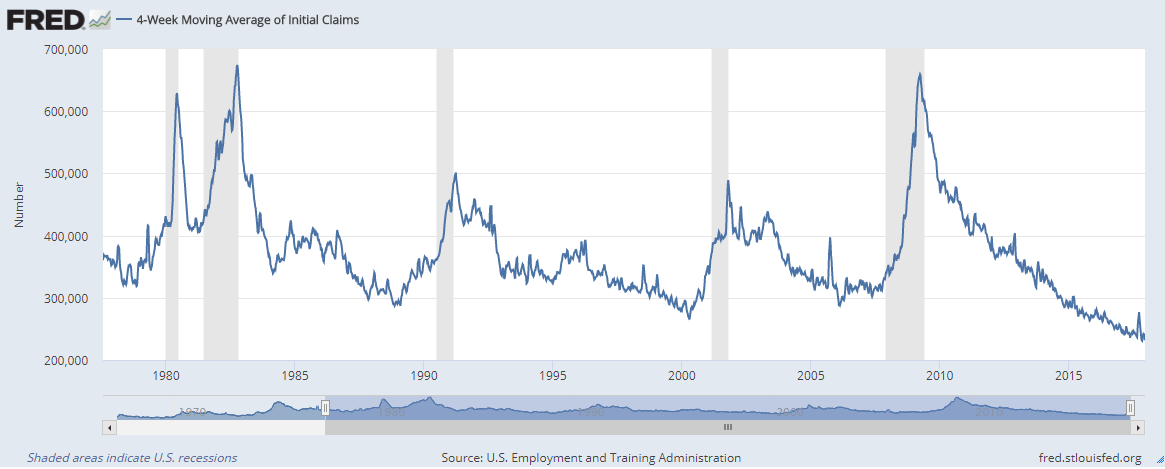
But, even though jobless claims are at 40-year lows, it's actually lower than it appears. While jobless claims are at their lowest level since 1973, the US population has grown from 210 million to 326 million.
Here's a chart of jobless claims (blue) together with US population (red):
Suffice it so say, joblessness is not the issue. And while we're at it, neither are real wages.
6. Not true: real wages aren't rising.
Real Wages
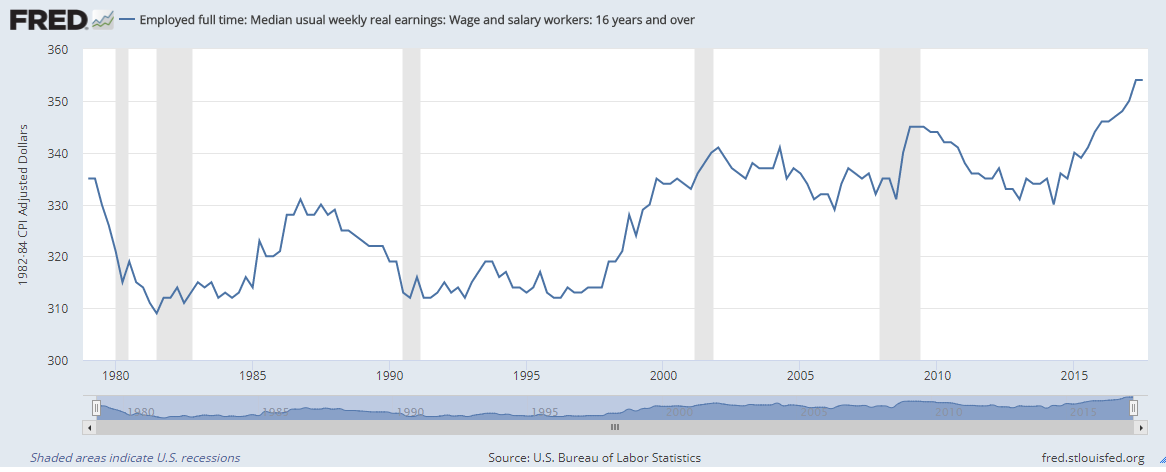
Wages, adjusted for inflation, are in fact at all-time historic highs for American workers.
The bullish argument is that the economy is healthy, the American worker is healthy, and so a recession is nowhere to be found.
The bearish argument is that unemployment is at a cyclical low, it will go higher, and the current rising wages with tightened labor market will make it more difficult for companies to earning outsized profits, and that will cut corporate profits and the market will drop.
Now it's time to talk about the new tax law.
NEW TAX LAW - WHAT DOES IT MEAN OR WHY DOES IT MATTER?
We don't debate politics here, we look at facts and in that vein we must address the reality that one of the largest tax reformations (cuts) becomes a new law in 2018 and the impact on the market in the immediate-term could be bullish.
The tax bill contains a 8% one-time tax on illiquid assets and a 15.5% tax on cash and cash equivalents held overseas. While the government had previously waited until a company repatriated cash to levy a 35% tax, it will now impose a 15.5% tax on cash earnings.
Meanwhile, the corporate tax rate cut could push companies to invest in new data centers, cloud services and other technology. That narrative is also backed by the increased deductions for capital spending in the new tax law.
Starting next year companies will pay 10.5% or 13.125% on half of the income from subsidiaries outside the U.S. They will pay taxes of 10.5% or 13.125% -- a discount to the new 21% corporate tax rate.
While the focus has been on mega tech and all that overseas cash -- the reality is that will likely be spent on stock buybacks or dividends and could have an one-time effect.
Apple, for example, had more than $250 billion in overseas cash at the end of last quarter. Instead of paying the old 35% corporate rate to bring that back to the U.S., Apple would now pay just 15.5%. That's the difference between $87.5 billion and $38.8 billion. Here comes Apple's new mega stock buyback plan.
But, Silicon Valley generally pays lower taxes than energy companies, telecoms and industrials, and will benefit less from the reduction in the corporate tax rate from 35% to 21%.
Or, said differently, the media can stop focusing on tech and turn to the rest of our economy.
Here is a snippet from a Wall Street Journal article:
Companies could bring back as much as $400 billion, according to one estimate, as they take advantage of an one-time cut for repatriation of earnings and cash held overseas written into the GOP tax overhaul.
That typically requires them to sell foreign holdings and buy assets denominated in dollars, which could boost the U.S. currency.
That typically requires them to sell foreign holdings and buy assets denominated in dollars, which could boost the U.S. currency.
WHAT NOW?
At Capital Market Laboratories we focus on the future -- not as in the next year, or even 3-years, but as in the next decade, or even two decades. We focus on the world changing trends that will occur, irrespective of recessions, booms and busts, interest rates, even wars.
It's the companies that power these trends, that are the pick-axes to the gold rush, that we have identified as our Top Picks. Let volatility happen, and markets crash. Let recessions happen, and economies spasm. That's natural -- and it will happen.
We are focused on how the world is changing, and in that space, we have confidence that nothing can stop these trends.
We are Capital Market Laboratories. Our research sits next to Goldman Sachs, JP Morgan, Barclays, Morgan Stanley and every other multi billion dollar institution as a member of the famed Thomson Reuters First Call. But while those people pay upwards of $2,000 a month on their live terminals, we are the anti-institution and are breaking the information asymmetry.
The precious few thematic top picks for 2017, research dossiers, and alerts are available for a limited time at a 80% discount for $29/mo. Join Us: Discover the undiscovered companies that will power technology's future.
Thanks for reading, friends.
Please read the legal disclaimers below and as always, remember, CML Pro does not make recommendations or solicitations for the sale or purchase of any security ever. We are not licensed to do so, and wouldn't do it even if we were. We share research and provide you the power to be knowledgeable to make your own decisions.
Legal
The information contained on this site is provided for general informational purposes, as a convenience to the readers. The materials are not a substitute for obtaining professional advice from a qualified person, firm or corporation. Consult the appropriate professional advisor for more complete and current information. Capital Market Laboratories ("The Company") does not engage in rendering any legal or professional services by placing these general informational materials on this website.
The Company specifically disclaims any liability, whether based in contract, tort, strict liability or otherwise, for any direct, indirect, incidental, consequential, or special damages arising out of or in any way connected with access to or use of the site, even if I have been advised of the possibility of such damages, including liability in connection with mistakes or omissions in, or delays in transmission of, information to or from the user, interruptions in telecommunications connections to the site or viruses.
The Company makes no representations or warranties about the accuracy or completeness of the information contained on this website. Any links provided to other server sites are offered as a matter of convenience and in no way are meant to imply that The Company endorses, sponsors, promotes or is affiliated with the owners of or participants in those sites, or endorse any information contained on those sites, unless expressly stated.