


GrubHub Smashes Earnings and Explodes Higher -- What Happens Next?
GrubHub Inc (NYSE:GRUB) : The Repeating Pattern in GrubHub Inc That Triggers Right After an Earnings Beat and The Option Trade That Follows
Date Published: 2018-07-25
Disclaimer
The results here are provided for general informational purposes, as a convenience to the readers. The materials are not a substitute for obtaining professional advice from a qualified person, firm or corporation.LEDE
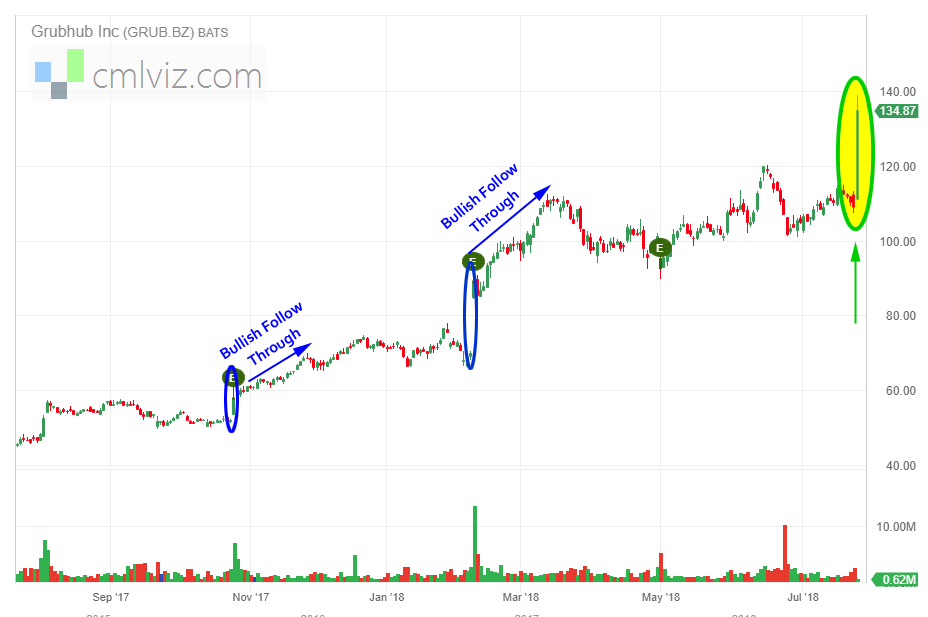
GrubHub Inc (NYSE:GRUB) stock soared on an earnings crush on Wednesday 7-25-2018 before the market opened, with the stock finishing up $25.67 or 23.54% to a new all-time high, by a lot. One day after 7-25-2018 would be 7-26-2018, near the close.While this stock price is uncharted territory, the reaction off of a big earnings beat is not, nor is breaking through an all-time high off of that earnings report.
GrubHub Inc (NYSE:GRUB) Earnings
This just happened:
But if we take our focus away from the giant candle, and look backwards to the last two earnings releases before this one, circled in blue, we see two other gaps up off of earnings, which also both led the stock to all-time highs.
We can also see continued bullish momentum for a short window to follow. This won't work every time, there is no true silver bullet, but a pattern has persisted, and it has persisted for more than just this short time period.
In GrubHub Inc, if the stock move immediately following an earnings result was large (3% or more to the upside), if we test waiting one-day after that earnings announcement and then bought a three-week at the money (50 delta) call, the results were quite strong.
Here's the set-up of a more robust back-test:
Rules
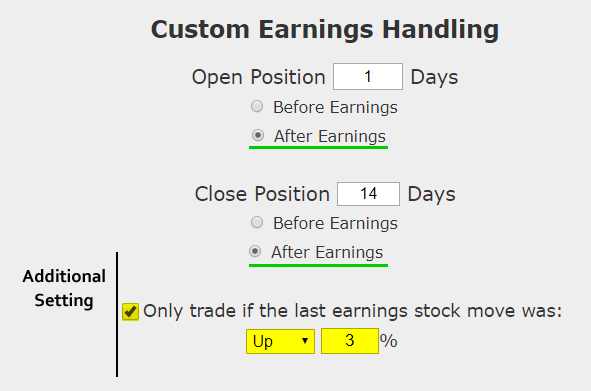
* Condition: Wait for the one-day stock move off of earnings, and if it shows a 3% gain or more in the underlying, then, follow these rules:* Open the long at-the-money call one-trading day after earnings.
* Close the long call 14 calendar days after earnings.
* Use the options closest to 21 days from expiration (but more than 14 days).
This is a straight down the middle direction trade -- this trade wins if the stock is continues on an upward trajectory after a large earnings move the two-weeks following earnings and it will stand to lose if the stock does not rise. This is not a silver bullet -- it's a trade that needs to be carefully examined.
But, this is a conditional back-test, which is to say, it only triggers if an event before it occurs.
RISK CONTROL
Since blindly owning calls can be a quick way to lose in the option market, we will apply a tight risk control to this analysis as well. We will add a 40% stop loss and a 40% limit gain.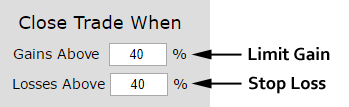
In English, at the close of every trading day, if the call is up 40% from the price at the start of the trade, it gets sold for a profit. If it is down 40%, it gets sold for a loss. This also has the benefit of taking profits if there is a stock rally early in the two-week period rather than waiting to close 14-days later.
Another risk reducing move we made was to use 21-day options and only hold them for 14-days so the trade doesn't suffer from total premium decay.
RESULTS
If we bought the at-the-money call in GrubHub Inc (NYSE:GRUB) over the last three-years but only held it after earnings and after an earnings pop higher, we get these results:The mechanics of the TradeMachine® Stock Option Backtester are that it uses end of day prices for every back-test entry and exit (every trigger).
Track this trade idea. Get alerted for ticker `GRUB` 1 days after earnings
Looking at Averages
The overall return was 501.4%; but the trade statistics tell us more with average trade results:➡ The average return per trade was 42.46% over each 13-day period.
➡ The average return per winning trade was 106.73% over each 13-day period.
➡ The average return per losing trade was -43.22% over each 13-day period.
Looking at the Last Year
While we just looked at a multi-year back-test, we can also hone in on the most recent year with the same test:| GRUB: Long 50 Delta Call | |||
| % Wins: | 100% | ||
| Wins: 3 | Losses: 0 | ||
| % Return: | 623.8% | ||
Tap Here to See the Back-test
Now we see a 623.8% return over the last year and a 100% win-rate.
➡ The average return for the last year per trade was 126.51% over each 13-day period.
WHAT HAPPENED
This is how people profit from the option market. Take a reasonable idea or hypothesis, use a rationale system, and test it. Tap the link below to find more of these patterns:Tap Here to See the Tools at Work
Risk Disclosure
You should read the Characteristics and Risks of Standardized Options.
Past performance is not an indication of future results.
Trading futures and options involves the risk of loss. Please consider carefully whether futures or options are appropriate to your financial situation. Only risk capital should be used when trading futures or options. Investors could lose more than their initial investment.
Past results are not necessarily indicative of future results. The risk of loss in trading can be substantial, carefully consider the inherent risks of such an investment in light of your financial condition.
Please note that the executions and other statistics in this article are hypothetical, and do not reflect the impact, if any, of certain market factors such as liquidity and slippage.