


Understanding Option Skew -- What it is, Why it Exists, How it Can Make You Money
Understanding Option Skew -- What it is and Why it Exists
Date Published: 2018-12-05
Written by Ophir Gottlieb
Disclaimer
The results here are provided for general informational purposes, as a convenience to the readers. The materials are not a substitute for obtaining professional advice from a qualified person, firm or corporation.Lede
Market volatility brings opportunity, but it also shakes investors and requires a knowledge base increase. When the market goes straight up, there isn't a lot to do other than ride the trend.When the market changes its volatility regime, for option trading, that means being able to decipher the difference between various strike prices and how the pricing of those options impacts trading decisions. In option speak, that is simply called "volatility." Today we will see the impact of option skew, directly and empirically, on Apple and option trading for that security.
For better or worse, it can absolutely be the difference between a profitable trade or a losing one. The difference between can be overwhelming -- say, an at-the-money straddle or an out-of-the-money strangle -- where one can lose big and the other can win big, even though the premise behind the positions is actually identical -- in this case, a bet on a big market move.
Let's do it -- let's get to the next level and then see the direct impact on trading with empirical data. We start from the beginning.
What Does Skew Mean?
Volatility is often discussed as a single number. In the real world, the volatility of each strike price and in each month is different than the neighboring one. Skew is simply the volatility curve formed by plotting the individual volatilities of each strike. The shape of this curve is often referred to as the volatility "smile" or "smirk."Normal Skew Shape
Normally the skew forms a downward smile (or smirk) -- lower strikes have higher volatility than higher strikes. We have included a skew chart for NFLX June 2017 options as of 10-23-2015 below.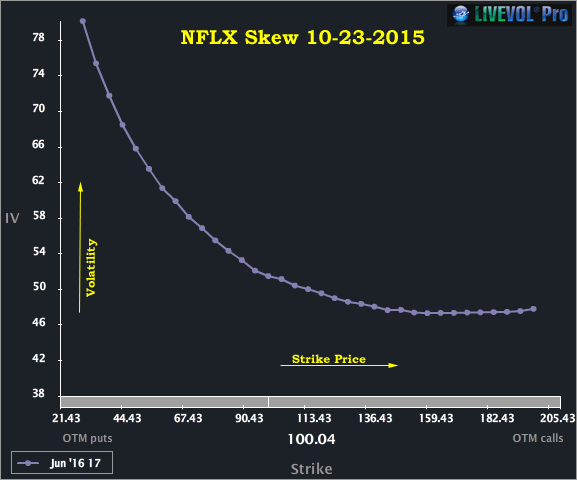
We can see the lower strike prices (the out of the money puts on the left side of the chart) have higher volatility than the at-the-money (ATM) options and the out-of-the-money (OTM) calls to the right side of the chart. This volatility smile shape exists for two reasons:
First, because of a basic real-life principle about the investing world: The vast majority of the equity positions are long. This is driven by rules that govern pension funds, mutual funds, 401(K)s, and the retail public, as well as a general phenomenon that investors prefer to own securities in the expectation that they will rise in price rather than sell them in the expectation that they will decline. These realities have a direct impact on options prices (and therefore volatilities).

A long investor makes two general options trades to hedge his or her long stock. The first is to purchase downside puts as insurance against a portfolio drop. This increases the demand for downside puts (the left side of that chart, above). Like all free-market prices, increases in demand create increases in price. Ceteris paribus, the only way to make an option more expensive is to raise the volatility.
The second hedging trade is to sell calls against long stock (covered calls). This acts both as an income-generating strategy and as a hedge for downside moves. Call sellers imply a decrease in demand for upside calls. This decreased demand lowers prices (volatility) for the OTM calls (right hand side of the chart).
The second reason a volatility skew exists is that the market moves down faster than it moves up. October and November of 2018 are exhibit 1A, where an entire year's worth of gains disappeared in a matter of weeks.
Historically, bear markets are much more abrupt and realize outsized returns faster than bull markets. The more expensive OTM puts compared to OTM calls is simply a reflection by the options market that downside risk is greater than upside risk.
On a side note: Remember that the stock market doesn't create new rules, it simply reflects the rules of the universe. Our universe imposes on us the reality that creation takes longer than destruction -- so bear markets (destruction of wealth) are faster and more abrupt than bull markets (creation of wealth) and option skew reflects that reality.
Stock Price and Volatility Movement
Normally, when stocks go down, volatility (vol) goes up because investors that are long stock buy puts for protection which creates greater demand for options.Alternatively, when stocks move up, vol goes down because investors that are long stock sell OTM calls for income which creates less demand for options.
Abnormal Skew
For certain types of companies, the demand for upside calls is so great that the skew (vol) bends up for OTM calls as well -- this can either be speculative call buying (like a takeover rumor or earnings speculation) or a company where the upside risk is perceived to be as great as the downside (like bio-techs with a FDA decision coming).Yahoo! was a company that had been a speculative favorite for a possible buyout. We've included the YHOO skew chart for the April 2011 options below.
Note how the skew for YHOO was parabolic. The downside bends up due to the phenomena presented prior. The upside skew bends up due to the order flow, which is pre-dominantly speculative call buying on takeover rumors.
For the naturally curious reader, biotechs can be great examples of the second type of company -- those that exhibit an upside skew shape (the market reflects as much upside risk as downside).
Here's an image of Facebook's skew, just a week before earnings were due out in 2015.
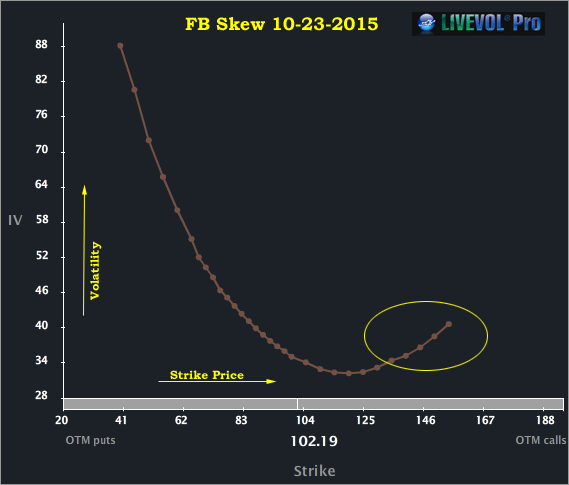
Note that the highest strike prices do show elevated volatility relative to the at-the-money strikes. This phenomenon is simply a reflection that market makers are more willing to buy than to sell far OTM calls in Facebook ahead of earnings. This should not necessarily be read as an indication of a large upside move.
Why It Matters to Trading
Ok, enough with theory -- now it's back to trading. In the months of October and November 2018, while the market slid down, it also faced some of its most volatile days in years, even decades. That meant that simply owning straddles (calls and puts), without making a directional bet, worked extraordinarily well.It turns out that when the market shifts, we need a minimum amount of data to adjust, and succeed.
Fear, uncertainty, doubt, unclear news headlines, politics -- these are all trade-able events, at any time, without concern for earnings.
Apple as a Test Case: Turning It into a Trade -- And Then Using Skew
We have examined the outcome of going long a short-term at-the-money (50 delta) straddle, in options that are the closest to seven-days from expiration. But we have a rule -- it's a stop and a limit of 10%, and, we back-test re-opening the position immediately, as opposed to waiting for 7-days later.Let's not worry about stock direction or earnings, let's try to find a back-test that benefits from volatility. Here it is, first, we enter the long straddle.
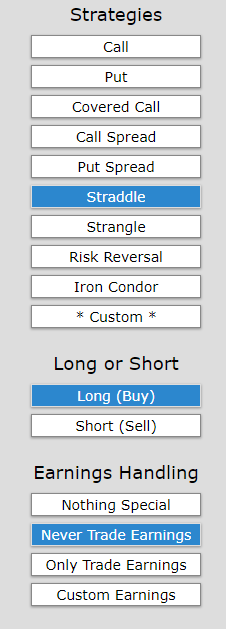
Second, we set a very specific type of stop and limit:
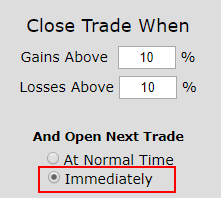
At the end of each day, the back-tester checks to see if the long straddle is up or down 10%. If it is, it closes the position, and re-opens at the same time, another long straddle, but this one now re-adjusted for what is the newest at-the-money strike price.
We have a full blown tutorial write up on this type of stop/limit behavior in the Discover Tab: Stops & Limits Roll Timing What does "open again at normal time" vs "immediately" mean?
The Results
We back-tested this only over the two months from 2018-10-01 to 2018-12-01. We are hyper focusing not on a long drawn out pattern, but rather this time, right now, this period of volatility.
| AAPL: Long 50 Delta Straddle | |||
| % Wins: | 53.8% | ||
| Wins: 14 | Losses: 12 | ||
| % Return: | 107% | ||
Tap Here to See the Back-test
The mechanics of the TradeMachine® Stock Option Backtester are that it uses end of day prices for every back-test entry and exit (every trigger).
Notice that this has triggered a trade 26 times in eight weeks. This is a fast moving, re-adjusting straddle. The idea is simple:
Take well bounded risk, small, and direction-less, and let a tweet, a news headline, an Apple headline, a day of pessimism or a day of optimism, whatever -- move the market, as it has so often in this new volatility regime.
Now, let's look at the impact of skew.
Skew - Yeah, It's Everything
During that short time period, where Apple stock was down 21%, we see an option trade that takes no stock position at all, but was up 107%. It's fair to say that 107% over a two-month period would be head over heels impossibly good for an ongoing trade.But the phenomenon we saw was not just that the option prices (volatility) were too low, but in reality, it was the skew that was really too low. And how do we see that? We check further out of the money strangles.
Here is the same back-test, over the same time period, but back-testing owning the out of the money call and put (30 delta) rather than the at the money call and put (50 delta). Buckle up:
| AAPL: Long 30 Delta Strangle | |||
| % Wins: | 50% | ||
| Wins: 16 | Losses: 16 | ||
| % Return: | 568% | ||
Tap Here to See the Back-test
Yep. That same idea -- which was simply to own straddles during a volatile period, turned a stock return of -21%, to a straddle return of 107%, and then using skew, into a strangle that returned 586%. Yes, in eight weeks.
Setting Expectations
Since we use end of day open and closes, while this strategy has an overall return of 568%, the trade details keep us in bounds with expectations:➡ The average percent return per trade was 19.6% over each few day period.
➡ The average percent return per winning trade was 64.9 over each few day period.
➡ The percent return per losing trade was -25.6% over each few day period.
The average win is more than twice as large as the average loss. Further, this trade takes no stock direction risk at all.
While the volatility proved to be too low for that time period (the at the money straddle), the real opportunity was in the skew -- the out of the money options were drastically underpriced and that had a direct impact on trading.
Extending It
We just looked at buying options -- but skew can be one of the most powerful uses of volatility to create spreads, like a call spread, and to identify the option to buy and the option to sell. Skew is everywhere, and option trading is volatility trading, whether you mean it to be or not.What Happened
There's a lot less luck to successful option trading than many people realize. Wining traders rarely guess a strike, guess an expiration, guess a stock and let it rip. No...They make decisions based on rules and those rules are governed by empirical data, just like what we shared above.
But, for the first time, that same mechanism for creating rules and finding empirical results, is now available not just to the mega billion dollar investment banks and hedge funds, but to retail investors. The real guts of the economy and this country.
By all means, please, tap here to get your hands on this capability and become the expert in the room.
This is trade analysis, not a recommendation.
Legal Stuff:
Options involve risk. Prior to buying or selling an option, an investor must receive a copy of Characteristics and Risks of Standardized Options. Investors need a broker to trade options, and must meet suitability requirements.
The information contained on this site is provided for general informational purposes, as a convenience to the readers. The materials are not a substitute for obtaining professional advice from a qualified person, firm or corporation. Consult the appropriate professional advisor for more complete and current information. I am not engaged in rendering any legal or professional services by placing these general informational materials on this website.
I specifically disclaims any liability, whether based in contract, tort, strict liability or otherwise, for any direct, indirect, incidental, consequential, or special damages arising out of or in any way connected with access to or use of the site, even if I have been advised of the possibility of such damages, including liability in connection with mistakes or omissions in, or delays in transmission of, information to or from the user, interruptions in telecommunications connections to the site or viruses.
I make no representations or warranties about the accuracy or completeness of the information contained on this website. Any links provided to other server sites are offered as a matter of convenience and in no way are meant to imply that I endorse, sponsor, promote or am affiliated with the owners of or participants in those sites, or endorse any information contained on those sites, unless expressly stated.