


The Exact Trigger that Indicates Volatility in Paycom Software Inc
Paycom Software Inc (NYSE:PAYC) : The Exact Trigger that Indicates Volatility
Date Published: 2019-01-21
Disclaimer
The results here are provided for general informational purposes, as a convenience to the readers. The materials are not a substitute for obtaining professional advice from a qualified person, firm or corporation.Preface
There is a trigger in Paycom Software (NYSE:PAYC) that has preceded a large stock move. Up or down, the stock's move, after the trigger, has turned into a winner.The strategy won't work forever, but for now it is a volatility back-test that has not only returned 238% but has also shown a win-rate of 100% while taking no stock direction risk.
Simply owning puts and calls together, blindly, can be shown to be a losing strategy. If only option trading was that easy. So, the need has arisen -- an empirical and structured trigger that indicates when a large stock move is coming so owning a strangle has a higher probability of succeeding.
There is such a technical condition, and we will review it, right now.
Here is a quick 3-minute video that demonstrates the back-test:
The Short-term Option Volatility Trade in Paycom Software Inc
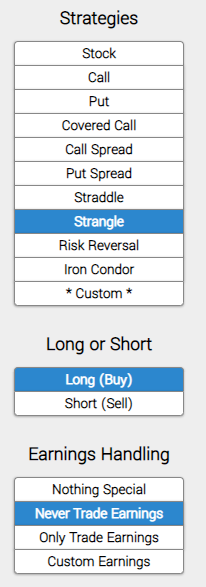
We will examine the outcome of going long a short-term out-of-the-money (40 delta) strangle (buying an out of the money call and buying an out of the money put), in options that are the closest to 14-days from expiration. But we follow three rules:* Never Trade Earnings
Let's not worry about stock direction or earnings, let's try to find a back-test that benefits from volatility. Here it is, first, we enter the long strangle.
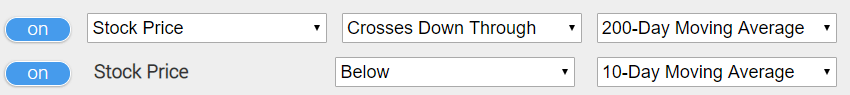
* Use a technical trigger to start the trade, specifically:
Wait until the day that the stock price crosses below the 200-day moving average and the stock price is below the 10-day moving average. Here is a nice simple image of the technical requirement:
* Finally, we set a very specific type of limit:
* Use a 30% limit gain and stop loss
* Close the trade after 10 trading days, if the limit or stop has not been hit.
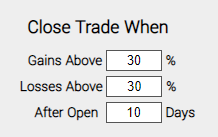
At the end of each day, the back-tester checks to see if the long strangle is up or down 30%. If it is, it closes the position. If after 10 trading days the limit has not been hit, the strangle is closed so not to suffer total time decay.
Seeing It in Action
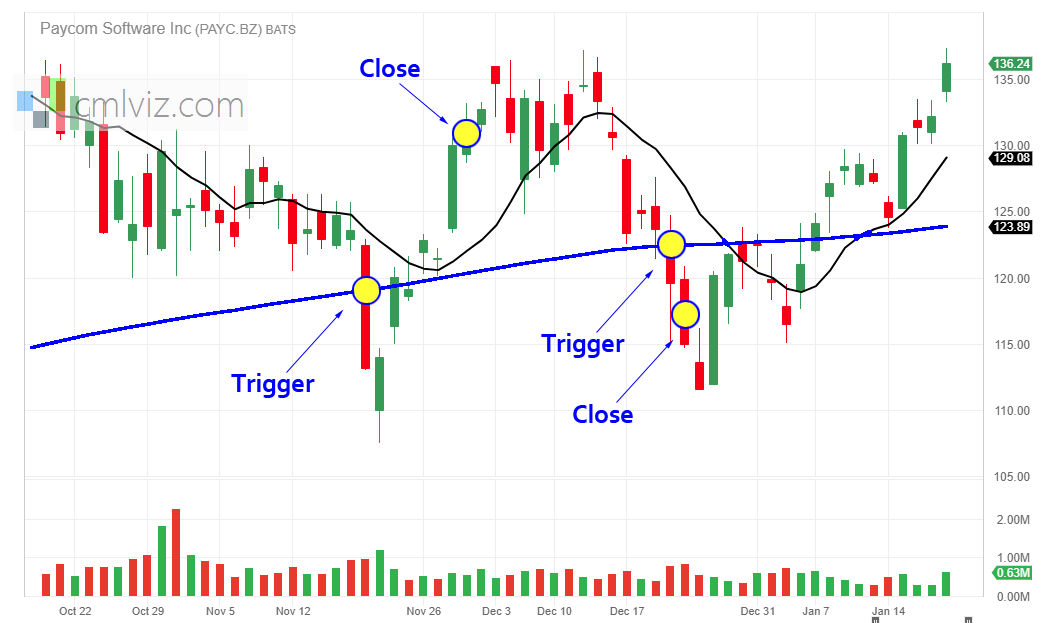
Before we get to the 5-year results, let's just look at a stock price chart for PAYC from October 2018 through Jan 2019 (a three-month window).Layered on top of the stock chart we have plotted the 10-day (simple) moving average (DMA) in black and the 200 DMA in blue.
We can see two times that the stock dropped below the 200 DMA from above, while the stock price was below the 10 DMA. Both of those times are marked as "triggers."
The fist trigger occurred on Nov 19th with the stock closing at $113.18. Nine days later the stock had risen to $130.05 and the strangle back-test showed a 80% gain and was closed.
The second trigger occurred on Dec 20th with the stock closing at $119.56. One day later the stock dropped to $115.1 and the strangle back-test showed a 52% gain and was closed.
So, we see in just this short window how the technical trigger identified a quick volatility period -- once profiting from an upward rebound, and once profiting from a continued stock slide.
RESULTS
Here are the results over the last five-years in Paycom Software Inc:| PAYC: Long 40 Delta Strangle | |||
| % Wins: | 100% | ||
| Wins: 6 | Losses: 0 | ||
| % Return: | 238% | ||
Tap Here to See the Back-test
The mechanics of the TradeMachine® Stock Option Backtester are that it uses end of day prices for every back-test entry and exit (every trigger).
Setting Expectations
While this strategy had an overall return of 238%, the trade details keep us in bounds with expectations:➡ The average percent return per trade was 53.1%.
Checking the Moving Average
You can check to see the moment a stock dips below the 200-day MA for PAYC on the Pivot Points tab on www.CMLviz.com.Back-testing More Time Periods in Paycom Software Inc
Now we can look at just the last year as well:| PAYC: Long 40 Delta Strangle | |||
| % Wins: | 100% | ||
| Wins: 2 | Losses: 0 | ||
| % Return: | 102% | ||
Tap Here to See the Back-test
WHAT HAPPENED
Click a mouse button a few times. Use computing power. Find trades.Tap here to see it for yourself
Risk Disclosure
You should read the Characteristics and Risks of Standardized Options.
Past performance is not an indication of future results.
Trading futures and options involves the risk of loss. Please consider carefully whether futures or options are appropriate to your financial situation. Only risk capital should be used when trading futures or options. Investors could lose more than their initial investment.
Past results are not necessarily indicative of future results. The risk of loss in trading can be substantial, carefully consider the inherent risks of such an investment in light of your financial condition.
Please note that the executions and other statistics in this article are hypothetical, and do not reflect the impact, if any, of certain market factors such as liquidity and slippage.