


Technical Short Volatility Ratio Spread Trade and Trigger in the Nasdaq 100 QQQ
QQQ: Technical Short Volatility Ratio Spread Trade and Trigger
Date Published: 2019-04-04
Disclaimer
The results here are provided for general informational purposes from the CMLviz Trade Machine Stock Option Backtester as a convenience to the readers. The materials are not a substitute for obtaining professional advice from a qualified person, firm or corporation.LEDE
A new ETF scan will be introduced to Trade Machine by Monday April 8th. This is one example of that new scan.Preface
Some may balk at the idea of a multi-legged option strategies -- too complex, too many trades, not my style. It isn't any of those things -- and in the Nasdaq 100 QQQ ETF, there's only so long the results can be ignored when the market hits a volatility zone -- or when it doesn't.A proper portfolio of option trades should likely consist of more than straight bullish and bearish directional bets. ETFs can be a marvelous tool for selling volatility and making non directional option trading backtests while collecting a credit.
Building the Strategy Before We See the Results
We constructed a multi-leg option trading strategy for the S&P 500 ETF, SPY. It has a bearish tilt, but it does turn a profit in a bull market as well.Here is the image of the strategy created in Trade Machine's custom strategy builder.
As usual, rather than take this is one big trade, we can actually break it into two familiar trades. This could be one way to apply this lesson in real life. That is, open 2 put spreads.
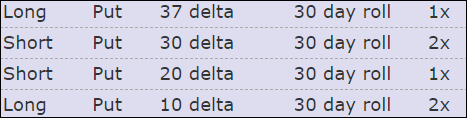
Rules
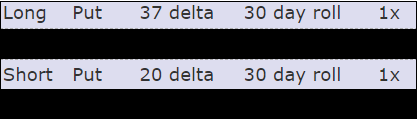
The first leg is simply long one put spread:* Long one 37/20 delta monthly put spread.
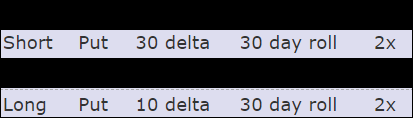
The second leg is simply short two put spreads:
* Short two 30/10 delta monthly put spreads.
This is short two put spreads
What Does This Mean?
This is casually called a ratio put spread, and specifically this is a 1 x 2 x 1 x 2 (read out loud as "1 by 2 by 1 by 2") put spread.The idea is to create an option position that:
* Creates a credit at onset.
* Has no upside risk (a stock rise to any price should be profitable).
* Has some downside bias (if the stock goes down it profits at the maximum level)
* Has a hard limit on total downside.
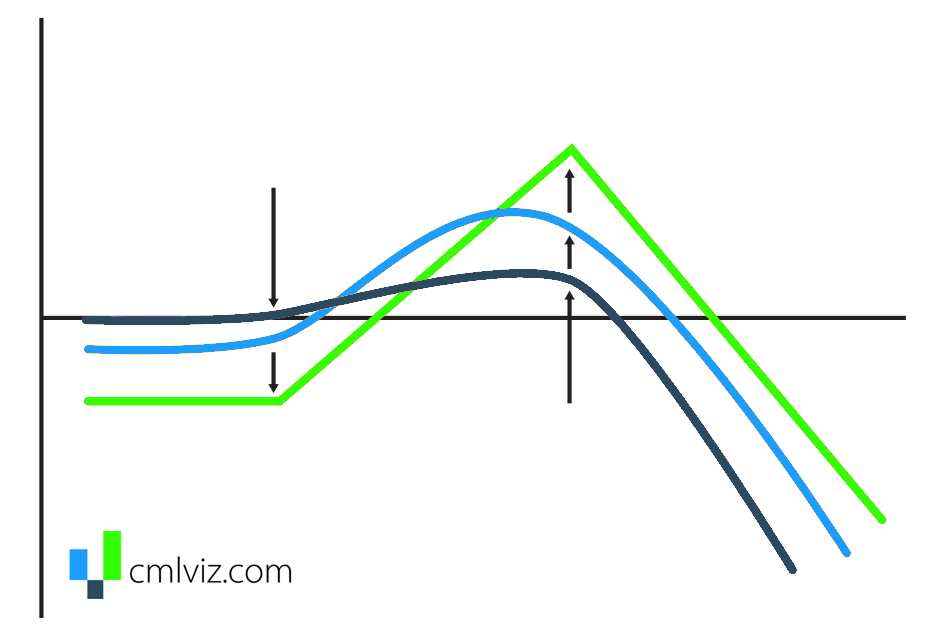
Broadly speaking, this is how all of that looks in a profit and loss chart at expiration:
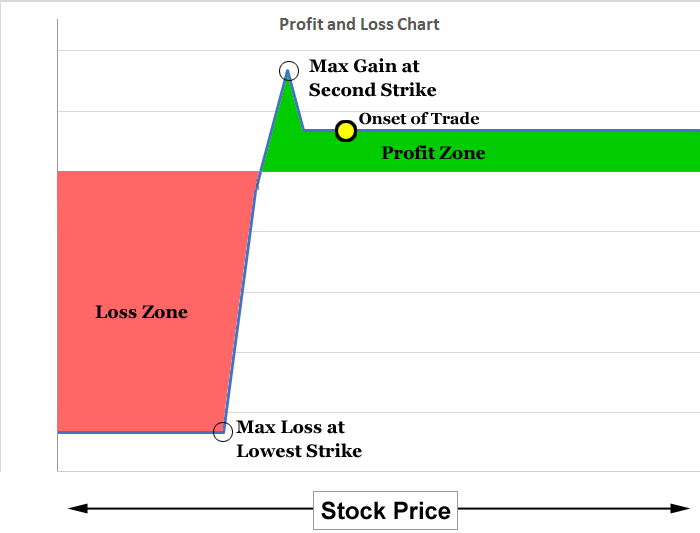
This strategy is profitable in the green shaded area, and shows a loss in the red shaded area.
To get your bearings:
* The maximum loss starts at the lowest strike price. Any stock price there or lower shows a capped loss at its maximum.
* The maximum gain occurred right at the second-strike price (the first short strike price), which is below the initial stock price at onset of the trade.
This strategy does well in a bull market but does best in a bear market. It does worst when there is a very large stock drop, but that loss is capped.
Addressing a Problem
As we can see from the PnL chart, while this trade does have limited risk, a big bearish move is going to be a loser. So, we need to add a condition using technical analysis that attempts to avoid the trade when the market is either in a down trend, or appears over bought and may soon turn into a down trend.We accomplish both goals with a set of rules:
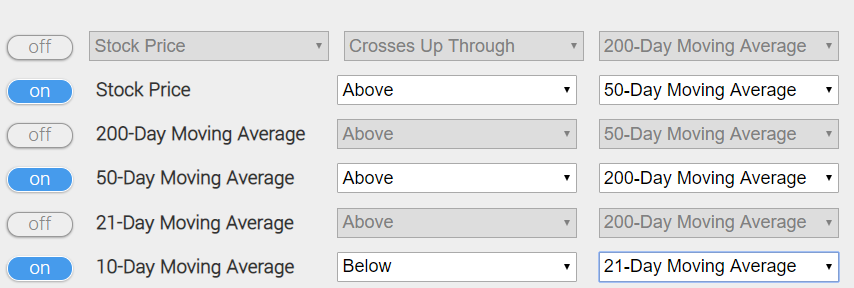
The first two requirements exist solely to try to avoid a bear market -- when a stock is above its 50-day moving average (DMA), and the 50 DMA is above the 200 DMA, we're not in a down trend.
The final requirement tries to avoid times when the stock is over bought. We do this by finding times where the short-term 10 DMA is below the 21 DMA.
Exit Filters
The exit filter for this backtest looks like this: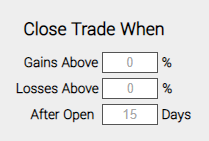
This means that after 15 trading days, the backtest is closed, irrespective of the profit and loss position. There is no other stop or limit setting.
Taken altogether, we have created a powerful filter. So, let's see it.
10-years: QQQ Option Backtester Results With Technical Analysis
Here are the results of this strategy over the last ten-years.| QQQ: Short Ratio Spread | |||
| % Wins: | 82.86% | ||
| Wins: 29 | Losses: 6 | ||
| % Return: | 248.9% | ||
Tap Here to See the Back-test
We're looking at 248.9% returns, on 29 winning trades and 6 losing trades.
➡ The average percent return over the last ten-years per trade was 6.45%.
QQQ Option Backtester Results With Technical Analysis
Here are the results over the last three-years in QQQ:| QQQ: Short Ratio Spread | |||
| % Wins: | 100% | ||
| Wins: 10 | Losses: 0 | ||
| % Return: | 180.1% | ||
Tap Here to See the Back-test
The mechanics of the TradeMachine® stock option backtester are that it uses end of day prices for every back-test entry and exit (every trigger).
Setting Expectations
While this strategy had an overall return of 180.1%, the trade details keep us in bounds with expectations:➡ The average percent return per trade was 13.82%.
Checking the Moving Average
You can check to see the moment a stock dips below the 200-day MA for QQQ on the Pivot Points tab on www.CMLviz.com.Back-testing More Time Periods in QQQ
Now we can look at just the last year as well:| QQQ: Short Ratio Spread | |||
| % Wins: | 100% | ||
| Wins: 2 | Losses: 0 | ||
| % Return: | 35.5% | ||
Tap Here to See the Back-test
We're now looking at 35.5% returns, on 2 winning trades and 0 losing trades.
➡ The average percent return over the last year per trade was 18.18%.
Next Steps
Tap here to use a pattern recognition machine. Be rigorous. You deserve it.Risk Disclosure
Past performance is not an indication of future results.
Trading futures and options involves the risk of loss. Please consider carefully whether futures or options are appropriate to your financial situation. Only risk capital should be used when trading futures or options. Investors could lose more than their initial investment.
Past results are not necessarily indicative of future results. The risk of loss in trading can be substantial, carefully consider the inherent risks of such an investment in light of your financial condition.
Please note that the executions and other statistics in this article are hypothetical, and do not reflect the impact, if any, of certain market factors such as liquidity and slippage.
You should read the Characteristics and Risks of Standardized Options.