


The Technical Trigger that Signals When to Buy the Dip in Netflix Inc (NASDAQ:NFLX)
The Technical Trigger that Signals When to Buy the Dip in Netflix Inc (NASDAQ:NFLX)
Date Published: 2019-06-06
Disclaimer
The results here are provided for general informational purposes from the CMLviz Trade Machine Stock Option Backtester as a convenience to the readers. The materials are not a substitute for obtaining professional advice from a qualified person, firm or corporation.Preface
The recent moves in the market have shown a pattern of rather abrupt consecutive down days on political or economic news which then reverses. We focused our research specifically less on a mantra of "buy the dip," and more on the empirical view of "when to buy the dip."After rigorous testing over multiple time periods and over tens of thousands of back-tests, today we demonstrate the technical conditions that have provided a strong short-term bullish momentum trigger for Netflix Inc (NASDAQ:NFLX) after an abrupt stock decline as well as, broadly speaking, the Nasdaq 100 index constituents over the five year period from 2014-2019.
How is This Useful Now
As of this writing, Netflix is not in a technical breakdown. The goal is to create a portfolio of backtests with alerts attached to them, so we don't have to stare at the screen all day, but rather Trade Machine is the work horse to notify when the ideas become actionable.So, we examine the empirical results, determine if it's a signal we want to be notified of when it does trigger, set the alert, and let it happen -- whenever that may be.
The Bullish Option Trade with Technical Analysis and Moving Averages in Netflix Inc (NASDAQ:NFLX) .
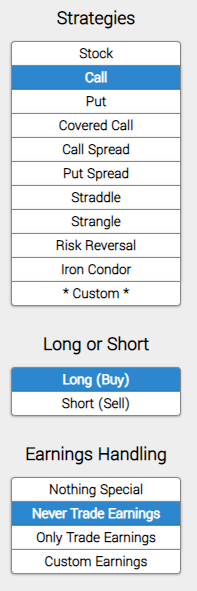
We will examine the outcome of going long an out-of-the-money (strike price is set to the 40 delta) call option, in options that are the closest to 30-days from expiration (using calendar days). But we follow three rules:* Never Trade Earnings
Let's not worry about earnings. Here it is, first, we enter the long call.
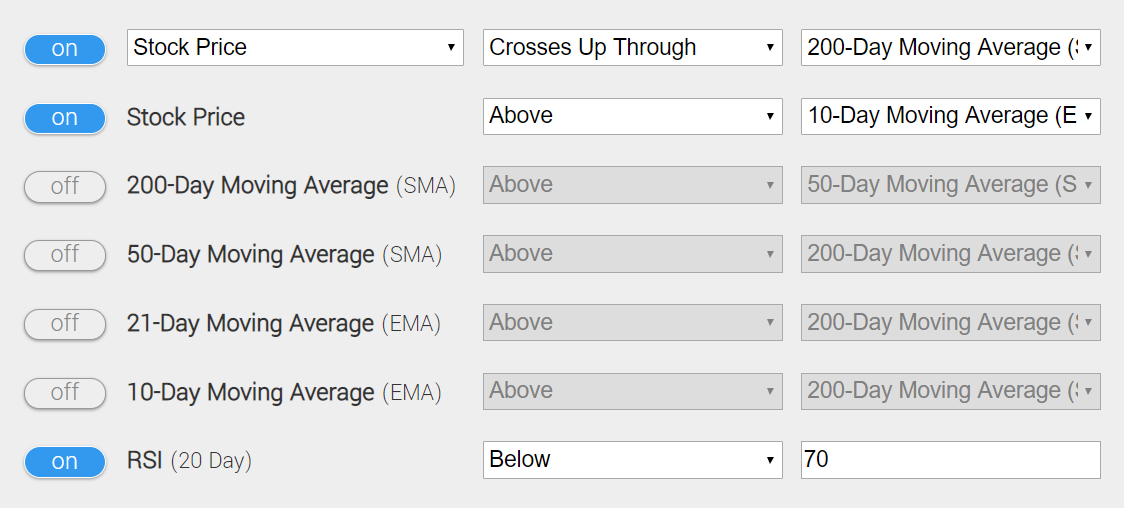
Use a technical trigger to start the trade, if and only if these specific items are met.
Rule 1: The first day a stock crosses from below the 200 day simple moving average (SMA) to above. That's a sign that the stock was in technical failure, but is reversing course.
Rule 2: The stock is already above the 10-day exponential moving average (EMA) -- that's an indicator of short-term momentum that was building before the stock came back through the 200-SMA.
Rule 3: RSI (using 20-days) is below 70, so the stock isn't overbought.
Here it is in an image from Trade Machine -- only focus on the settings where the filter is turned to "on.":
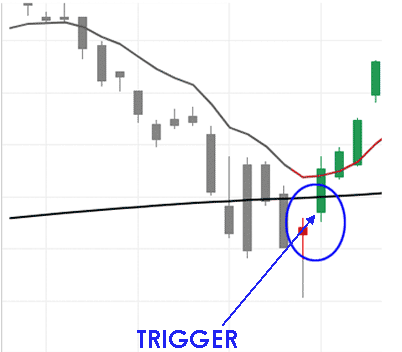
To put a picture to the words, here is an example for Apple from February of 2018, below, where the stock was in a down trend, then it crossed above the 200-day moving average while already above the 10-day EMA, and a stock rally ensued. This is the "CML Buy the Dip" trigger in action.
You can set an alert in Trade Machine®, which will track all of these moving parts for you, and message you when it triggers. In fact, you can do this with a portfolio of stocks for a portfolio of bullish and bearish triggers. let Trade Machine do the work for you -- there's no need to stare at the screen.
* Finally, we set a very specific type of limit:
* Use a 50% limit and a 50% stop.
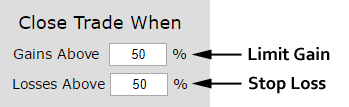
At the end of each day, the back-tester checks to see if the 30-day long call is either up or down 50%. If it is, it closes the position.
5-year Stock Option Backtester Results in Netflix Inc
Here are the results of opening a 30-day call option, using the 40 delta as the strike price, over the last five-years once this trigger has fired:
| NFLX: Long 40 Delta Call | |||
| % Wins: | 86% | ||
| Wins: 6 | Losses: 1 | ||
| % Return: | 144.6% | ||
Tap Here to See the Back-test
We're now looking at 144.6% returns, on 6 winning trades and 1 losing trades.
➡ The average percent return over the last year per trade was 24.45%.
RESULTS
Here are the results for the 30-day long call over the last three-years in Netflix Inc:| NFLX: Long 40 Delta Call | |||
| % Wins: | 80% | ||
| Wins: 4 | Losses: 1 | ||
| % Return: | 92.9% | ||
Tap Here to See the Back-test
The mechanics of the TradeMachine® are that it uses end of day prices for every back-test entry and exit (every trigger).
Setting Expectations
While this strategy had an overall return of 92.9%, the trade details keep us in bounds with expectations:➡ The average percent return per trade was 18.02% for each 14-day period.
Checking the Moving Average
You can check to see the values of all the moving averages discussed above with real-time daily prices, including live after hours prices, for NFLX by viewing the Pivot Points tab on www.CMLviz.com.Rigor to the Option Backtester and Backtesting
We compared this technical analysis trigger on the constituents of the Nasdaq 100 versus the results from the baseline. The baseline is simply owning calls and rolling them every 30-days with the same stop and limit as introduced above (50%%). Here's what we found:* Over one-year, the average trade return was 23% per 30-day period using the "buy the dip" technical trigger compared to just 6% using rolling calls with no technical structure.
* Over 2-years, the average trade return was 24% per 30-day period using the "buy the dip" technical trigger compared to just 5% using rolling calls with no technical structure.
* Over 3-years, the average trade return was 16% per 30-day period using the "buy the dip" technical trigger compared to just 7% for the baseline.
* Yes. We are empirical.
Back-testing More Time Periods in Netflix Inc
Now we can look at just the last year as well:
| NFLX: Long 40 Delta Call | |||
| % Wins: | 100% | ||
| Wins: 3 | Losses: 0 | ||
| % Return: | 84.2% | ||
Tap Here to See the Back-test
We're now looking at 84.2% returns, on 3 winning trades and 0 losing trades.
➡ The average percent return over the last year per trade was 35.1%.
Next Steps
Be rigorous. Tap here to try the Buy the Dip Trigger for yourself.Risk Disclosure
Past performance is not an indication of future results.
Trading futures and options involves the risk of loss. Please consider carefully whether futures or options are appropriate to your financial situation. Only risk capital should be used when trading futures or options. Investors could lose more than their initial investment.
Past results are not necessarily indicative of future results. The risk of loss in trading can be substantial, carefully consider the inherent risks of such an investment in light of your financial condition.
Please note that the executions and other statistics in this article are hypothetical, and do not reflect the impact, if any, of certain market factors such as liquidity and slippage.
You should read the Characteristics and Risks of Standardized Options.