


Identifying When a Stock (Precisely) Breaks out from a Dip - The Buy the Breakout Stock Trigger Progyny Inc
Progyny Inc (NASDAQ:PGNY) and Technical Analysis: Identifying When a Stock (Precisely) Breaks out from a Dip - The Buy the Breakout Stock Trigger
Date Published: 2020-09-22
Disclaimer
The results here are provided for general informational purposes from the CMLviz Trade Machine Stock Option Backtester as a convenience to the readers. The materials are not a substitute for obtaining professional advice from a qualified person, firm or corporation.Preface: Using Charts and Computations Simultaneously to Find the Recovery After a Dip Trigger
A bullish breakout off of a dip takes on many forms in the world of technical analysis, but following market mantras is insufficient for a trader looking to be data driven and precise.In this case we identified a trigger. This doesn't mean it's a trigger now, it means when it has happened, that has led to historically good returns, and in particular, good risk adjusted returns.
There is one technical requirement for the open and then one closing rule of the backtest:
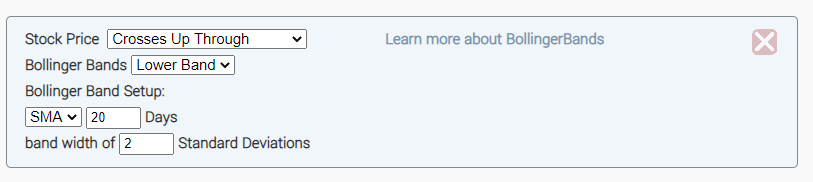
Open
Here is the set-up in Stock TradeMachine®.
Close
The close rule for this backtest is simply to wait 10-trading days later (about two-weeks).
For a visual representation we can turn to this example. Note how the backtest triggers once the stock price crosses up thorugh the lower band of the 2 SD Bollinger band, and the close trigger occurs 10-trading days later.
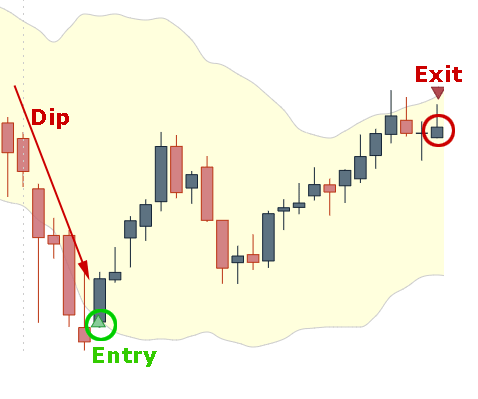
Translated from an image into words:
Open Trigger
1. Wait until the day that the stock crosses up through the lower band of a 2 SD Bollinger Band.
Close Trigger
2. Wait 10-trading days later.
If you 're not making use of computing power to examine patterns, then the algorithms are using you to profit. That's it. So, become the algorithm:
Tap here to finally find the trading outcomes from charts you've been looking for.
CML Efficiency Score™
At Capital Market Laboratories (CMLviz), we created a standardized reward to risk measurement for backtests called the CML Efficiency Score™ (ES).The ES takes the average trade return from each triggered backtest (the 'reward') and divides it by the maximum drawdown (the risk).
The max drawdown is measured as the largest open-to-trough decline in the value of a backtest for each new opening trade.
Our view is that an CML Efficiency Score above 0.80 is very good and above 1.0 is excellent. A number above 1.0 indicates that the average return is in fact larger than the maximum realized loss.
3-Year Backtest Results: Small Bollinger Band Breakout in Progyny Inc
Here are the results of a long stock position held either for 10 trading days (about one calendar month) tested over the last 3-years in Progyny Inc:| PGNY: Long Stock for One-Month | |||
| % Wins: | 100% | ||
| Wins: 3 | Losses: 0 | ||
| CML Efficiency Score™: | 1.37 | ||
| Return: | 33.5% | ||
Tap Here to See the Back-test
The mechanics of the Stock TradeMachine® are that it uses end of day prices for every back-test entry and exit (every trigger).
We see 3 wins and 0 losses with a total backtest return of 33.5%.
We note an CML Efficiency Score™ above 1.0 which is very strong.
Next Steps
If you use Technical Analysis, tap here to try Stock TradeMachine®.Risk Disclosure
Past results are not necessarily indicative of future results. The risk of loss in trading can be substantial, carefully consider the inherent risks of such an investment in light of your financial condition.
Please note that the executions and other statistics in this article are hypothetical, and do not reflect the impact, if any, of certain market factors such as liquidity and slippage.