AbbVie Inc, ABBV, earnings, results, risk, market, before

Disclaimer
The results here are provided for general informational purposes, as a convenience to the readers. The materials are not a substitute for obtaining professional advice from a qualified person, firm or corporation.
Preface
We have shown, empirically and objectively, that using the earnings date implied volatility as a back stop to theta decay has shown significantly positive results during both the recent six-years of this bull market, and the bear market of 2007-2008. AbbVie Inc (NYSE:ABBV) has a unique pattern that fits perfectly within this past performance, and it's time to take serious and deep dive into this back-test.
The Trade Before Earnings
What a trader wants to do is to see the results of buying an at the money straddle a 7 calendar days before earnings, and then sell that straddle just before earnings.

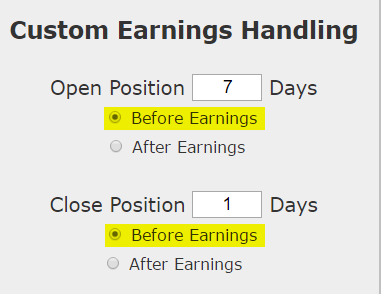
We are testing opening the position 7 calendar days before earnings and then closing the position 1 day before earnings. This is not making any earnings bet. This is not making any stock direction bet.
Once we apply that simple rule to our back-test, we run it on an at-the-money straddle:
Returns
If we did this long at-the-money (also called '50-delta') straddle in AbbVie Inc (NYSE:ABBV) over the last three-years but only held it before earnings we get these results:
Tap Here to See the Back-test
In the latest year this pre-earnings option trade has 4 wins and lost 0 times and returned 295.0%.
The mechanics of the TradeMachine™ are that it uses end of day prices for every back-test entry and exit (every trigger).
➡ Over just the last year, the average percent return per trade was 49.2% over each 7-day period.
Discovery
We discovered this trade rather quickly by using the Trade Machine Pro® scanner, looking over the S&P 500 and the '7-days pre-earnings long straddle' scan. Then we sorted by the largest average trade return.

Details
Let's take one step further any really dive into the details of this strategy over the last year -- we're talking point-by-point analysis.
Here is a table of the trades, the dates, the prices, and the results:

While the back-test shows 4 wins, it was really two of those trades that pushed the return so high. While we can focus on the two large trades, we can also focus on the two smaller ones as well. The point being not so much to focus on how much profit was shown historically, but to see how 'not very good' results turned out as well.
It turns out, empirically, when we tested this idea of short-bursts of risk exposure using the earnings date as a back stop to time decay, this approach has shown consistently profitable results during both the bull market and the most recent bear market.
For the curious minded, we do provide a thorough explanation of why this phenomenon exists, and welcome you to watch this 37 minute option volatility webinar (it's free) if so compelled.
Video: Volatility Mastery - How to Trade a Bear and Bull Market
These results are empirical, which is to say, they are objective. We are not inserting opinion.
WHAT HAPPENED
We don't always have to look at directional option trades, and certainly don't always have to look at bullish trades. This is it -- this is how people profit from the option market -- finding trading opportunities that avoid earnings risk and work equally well during a bull or bear market that show risk exposure in short-bursts of time.
To see how to do this for any stock we welcome you to watch this quick demonstration video:
Tap Here to See the Tools at Work
Thanks for reading.
Risk Disclosure
You should read the Characteristics and Risks of Standardized Options.
Past performance is not an indication of future results.
Trading futures and options involves the risk of loss. Please consider carefully whether futures or options are appropriate to your financial situation. Only risk capital should be used when trading futures or options. Investors could lose more than their initial investment.
Past results are not necessarily indicative of future results. The risk of loss in trading can be substantial, carefully consider the inherent risks of such an investment in light of your financial condition.
Please note that the executions and other statistics in this article are hypothetical, and do not reflect the impact, if any, of certain market factors such as liquidity and slippage.
Short Bursts of Risk Exposure Show Staggering Results in AbbVie Inc

The Secret to Option Trading Before Earnings
Date Published: 2018-03-14Author: Ophir Gottlieb
Disclaimer
The results here are provided for general informational purposes, as a convenience to the readers. The materials are not a substitute for obtaining professional advice from a qualified person, firm or corporation.
Preface
We have shown, empirically and objectively, that using the earnings date implied volatility as a back stop to theta decay has shown significantly positive results during both the recent six-years of this bull market, and the bear market of 2007-2008. AbbVie Inc (NYSE:ABBV) has a unique pattern that fits perfectly within this past performance, and it's time to take serious and deep dive into this back-test.
The Trade Before Earnings
What a trader wants to do is to see the results of buying an at the money straddle a 7 calendar days before earnings, and then sell that straddle just before earnings.

We are testing opening the position 7 calendar days before earnings and then closing the position 1 day before earnings. This is not making any earnings bet. This is not making any stock direction bet.
Once we apply that simple rule to our back-test, we run it on an at-the-money straddle:
Returns
If we did this long at-the-money (also called '50-delta') straddle in AbbVie Inc (NYSE:ABBV) over the last three-years but only held it before earnings we get these results:
| ABBV Long At-the-Money Straddle |
|||
| % Wins: | 100.00% | ||
| Wins: 4 | Losses: 0 | ||
| % Return: | 295.0% | ||
Tap Here to See the Back-test
In the latest year this pre-earnings option trade has 4 wins and lost 0 times and returned 295.0%.
The mechanics of the TradeMachine™ are that it uses end of day prices for every back-test entry and exit (every trigger).
Track this trade idea. Get alerted for ticker `ABBV` 7 days before earnings
➡ Over just the last year, the average percent return per trade was 49.2% over each 7-day period.
Discovery
We discovered this trade rather quickly by using the Trade Machine Pro® scanner, looking over the S&P 500 and the '7-days pre-earnings long straddle' scan. Then we sorted by the largest average trade return.

Details
Let's take one step further any really dive into the details of this strategy over the last year -- we're talking point-by-point analysis.
Here is a table of the trades, the dates, the prices, and the results:

While the back-test shows 4 wins, it was really two of those trades that pushed the return so high. While we can focus on the two large trades, we can also focus on the two smaller ones as well. The point being not so much to focus on how much profit was shown historically, but to see how 'not very good' results turned out as well.
It turns out, empirically, when we tested this idea of short-bursts of risk exposure using the earnings date as a back stop to time decay, this approach has shown consistently profitable results during both the bull market and the most recent bear market.
For the curious minded, we do provide a thorough explanation of why this phenomenon exists, and welcome you to watch this 37 minute option volatility webinar (it's free) if so compelled.
Video: Volatility Mastery - How to Trade a Bear and Bull Market
These results are empirical, which is to say, they are objective. We are not inserting opinion.
WHAT HAPPENED
We don't always have to look at directional option trades, and certainly don't always have to look at bullish trades. This is it -- this is how people profit from the option market -- finding trading opportunities that avoid earnings risk and work equally well during a bull or bear market that show risk exposure in short-bursts of time.
To see how to do this for any stock we welcome you to watch this quick demonstration video:
Tap Here to See the Tools at Work
Thanks for reading.
Risk Disclosure
You should read the Characteristics and Risks of Standardized Options.
Past performance is not an indication of future results.
Trading futures and options involves the risk of loss. Please consider carefully whether futures or options are appropriate to your financial situation. Only risk capital should be used when trading futures or options. Investors could lose more than their initial investment.
Past results are not necessarily indicative of future results. The risk of loss in trading can be substantial, carefully consider the inherent risks of such an investment in light of your financial condition.
Please note that the executions and other statistics in this article are hypothetical, and do not reflect the impact, if any, of certain market factors such as liquidity and slippage.


