Symbol not found


Why Alexion Stock Could Rip
Fundamentals Technicals | Support: 169.04 | Resistance: 190.92 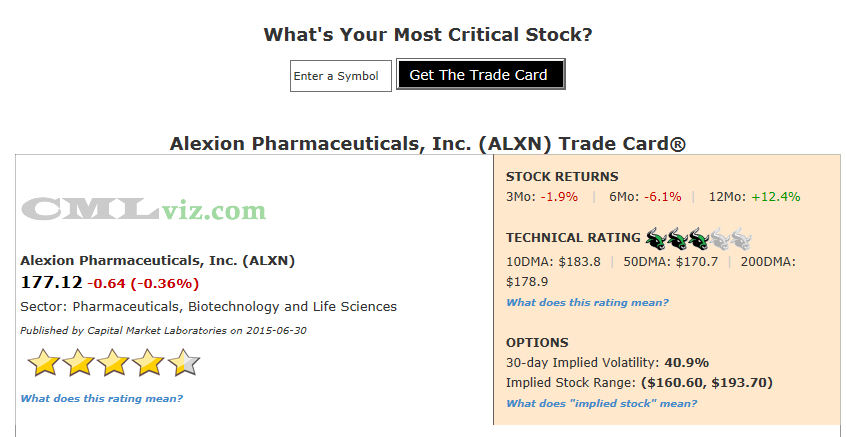
##***Biotech
Alexion Pharmaceuticals has 7 products in Phase II trials and 3 products in the Phase III trials. The stock is up nearly 600% in the last five-years and there could well be more to come.
Everything about the company's fundamentals can change in a single day when the FDA makes a definitive decision on a late stage drug trial. This couldn't be more true for ALXN which has so many things that look so good fundamentally but we must realize its entire revenue source comes from one drug, Soliris.
The good news is three-fold. First, Soliris treats two very rare diseases (genetic blood disorders) with weird names that are shortened as PNH and aHUS. There are no other existing drugs or treatments available for these diseases, so that's good news (piece number one) for ALXN and means the firm charges $400,000-to-$500,000 a year per patient. Further, the firm is in the midst of FDA trials to get the drug approved for other conditions. That's the second piece of good news, but it's not the best news.
ALXN has officially filed for regulatory approval of a new drug in the U.S. and internationally. The Motley Fool reports peak sales could reach $1 billion (ALXN sales in the last year were $2.3 billion). All of this good news comes from R&D, which ALXN is pouring money into. In fact, if we take all bio/pharmas with market caps above $15 billion and plot their R&D expenditures per dollar of revenue, ALXN is at the very top, and it's not even close.

Click here to interact with this chart
You'll note that even Biogen (BIIB) is fifth on this chart with its incredible foray into an Alzheimer's cure. You can read my earlier post Why Biogen Is Inches Away From Changing The World
But the R&D spend is working. In fact, ALXN's revenue (TTM) has risen for more than five consecutive quarters and has seen revenue grow 85% over the last two years.
The average estimate for next quarter's revenue of $628.4 million is substantially above last quarter's $600.3 million.![]()
Swing Golden Cross Alert: The short-term 10 day MA is now above the 50 day MA.
ALXN has a three bull (stock is range bound) technical rating because it's trading below both its 10-day (short-term) and its 200-day (long-term) moving averages. One the other side, we note that the stock is trading above the medium-term 50-day moving average and the 10-day MA is above the 50 -day MA ("swing golden cross").
Here are the consensus estimates for next quarter. Note that last quarter's actual result is included at the far right.
| EARNINGS ESTIMATES | |||||
| Earnings Date | EPS | Revenue (Mean) | Revenue (Median) | Last Quarter (Actual) | |
| 2015-07-23 | $1.30 | $628.4 M | $629.0 M | $600.3 M | Provided by ZACKS |
Let's look at the core elements that drive the company's fundamental rating.
|
|
|
Fundamentals Rating Summary |
|
|
| METRIC | CURRENT | 1YR AGO | 2YR AGO | DIRECTION |
| Revenue (TTM US$ Millions) | 2,267 | 1,779 | 1,228 |  |
| Operating Margin (QTR) | 1.257 | 1.60 | 1.55 | FALLING |
| Net Income (TTM US$ Millions) | 589 | 330 | 292 | RISING |
| Levered Free Cash Flow (TTM US$ Millions) | 467 | 428 | 255 | RISING |
| Research and Development (US$ Millions) | 221 | 191 | 75 | RISING |
| Research and Development Expense/Revenue | 0.368 | 0.338 | 0.220 | RISING |

|
|
| Stock Returns and Chart |
|
|
Before we dig into the fundamental trends that drive the rating, let's look at a two-year stock chart with regression channel and 10-day momentum (on the bottom).

Click here to interact with this stock chart
Now let's examine the visualizations of the critical financial measures.

| METRIC | CURRENT | 1YR AGO | 2YR AGO | DIRECTION |
| Revenue (TTM US$ Millions) | 2,267 | 1,779 | 1,228 | |
Revenue (TTM) is trending higher meaning that it has increased for at least five consecutive quarters (in this case it's over 20 consecutive quarters, each to new all-time highs).
Note that ALXN is growing revenue by 27.46% year-over-year. Any number over 20% has an added impact on the fundamental (star) rating.
What do all these numbers mean?
ALXN's fundamental rating benefited these results:
1. The one-year change was positive.
2. The one-year change was greater than +20% (an extra boost to the rating).
3. The two-year change was positive.
Finally, the up trend (consecutive quarters) in revenue benefited the fundamental (star) rating.
Let's look at Revenue (TTM US$ Millions) in the chart below.

Click Here to Interact With This Chart
| METRIC | CURRENT | 1YR AGO | 2YR AGO | DIRECTION |
| Net Income (TTM US$ Millions) | 589 | 330 | 292 | RISING |
Net Income (after tax profit) over the trailing twelve months (TTM) for ALXN is rising, up 78% year-over-year. We do see a dip in the most recent quarter, but all told, the firm has turned into an earnings machine and the days of running at a loss are more than seven years old.
In our next chart we plot Net Income (TTM US$ Millions) in the blue bars and the quarterly results in the gold line. Note the rising bars from a year ago (four quarters ago).

Click Here to Interact With This Chart
| METRIC | CURRENT | 1YR AGO | 2YR AGO | DIRECTION |
| Levered Free Cash Flow (TTM US$ Millions) | 467 | 428 | 255 | RISING |
Levered Free Cash Flow (FCF) (TTM US$ Millions) is a critical determinant of stock price since market cap is the present value of all future free cash flows. ALXN boats FCF of $428 million in the most recent trailing-twelve-months or a 9% year-over-year rise.
This cash metric is up $212 million from $255 million two-years ago.
For our next chart we plot Levered Free Cash Flow (TTM US$ Millions) in the blue bars through time.

Click Here to Interact With This Chart
| METRIC | CURRENT | 1YR AGO | 2YR AGO | DIRECTION |
| Research and Development (US$ Millions) | 221 | 191 | 75 | RISING |
Research and Development (R&D) (US$ Millions) in the most recent quarter for ALXN was $221 million. That's a 15% rise from last year and a 197% rise from two-years ago. The company is now at an all-time high in R&D expense. We do note that R&D spent per $1 of revenue is actually quite high at $0.37. Last year this measure was $0.34 (it's rising). R&D is the firm's life blood as it looks to expand into new markets and with new treatments.
In our final time series chart we plot Research and Development (US$ Millions) in the blue bars and R&D per dollar of revenue in the orange line. Note the rising bars from one-year ago.

Click Here to Interact With This Chart
Summary
Alexion Pharmaceuticals has seen revenue (TTM) grow to all-time highs for 20 consecutive quarters as it spends more on R&D per dollar of that revenue than any other biotech of its size (or larger). Even with that R&D spend, the firm has seen earnings and free cash flow grow. The company may very well be on the brink of a major shift with a broader usage for its singular revenue driver right now and a potentially totally new treatment to be available in the US, Europe and Japan.
Solaris puts ALXN in an incrediblt high margin niche market with a treatment that by all accounts does in fact save lives.
ALXN also has several products in various phase trials and if any of these "scenarios" work out, the firm could grow its revenue base two-fold within a few years. Alexion is one of the most exciting new comers into the arena of "soon to be large cap" bio/pharma companies and has stellar fundamentals behind its nearly 600% stock rise over the last five years.