


Technical Bullish Momentum Trade and Trigger in Applied Materials Inc
Applied Materials Inc (NASDAQ:AMAT) : Technical Bullish Momentum Trade and Trigger
Date Published: 2019-03-19
Disclaimer
The results here are provided for general informational purposes from the CMLviz Trade Machine Stock Option Backtester as a convenience to the readers. The materials are not a substitute for obtaining professional advice from a qualified person, firm or corporation.Lede
The semiconductors have been ripping and with them the guts to their tooling, Applied Materials Inc (NASDAQ:AMAT) and Lam Research (LRCX). Today we look at what has been the opportune time from a swing trade in Applied.Preface
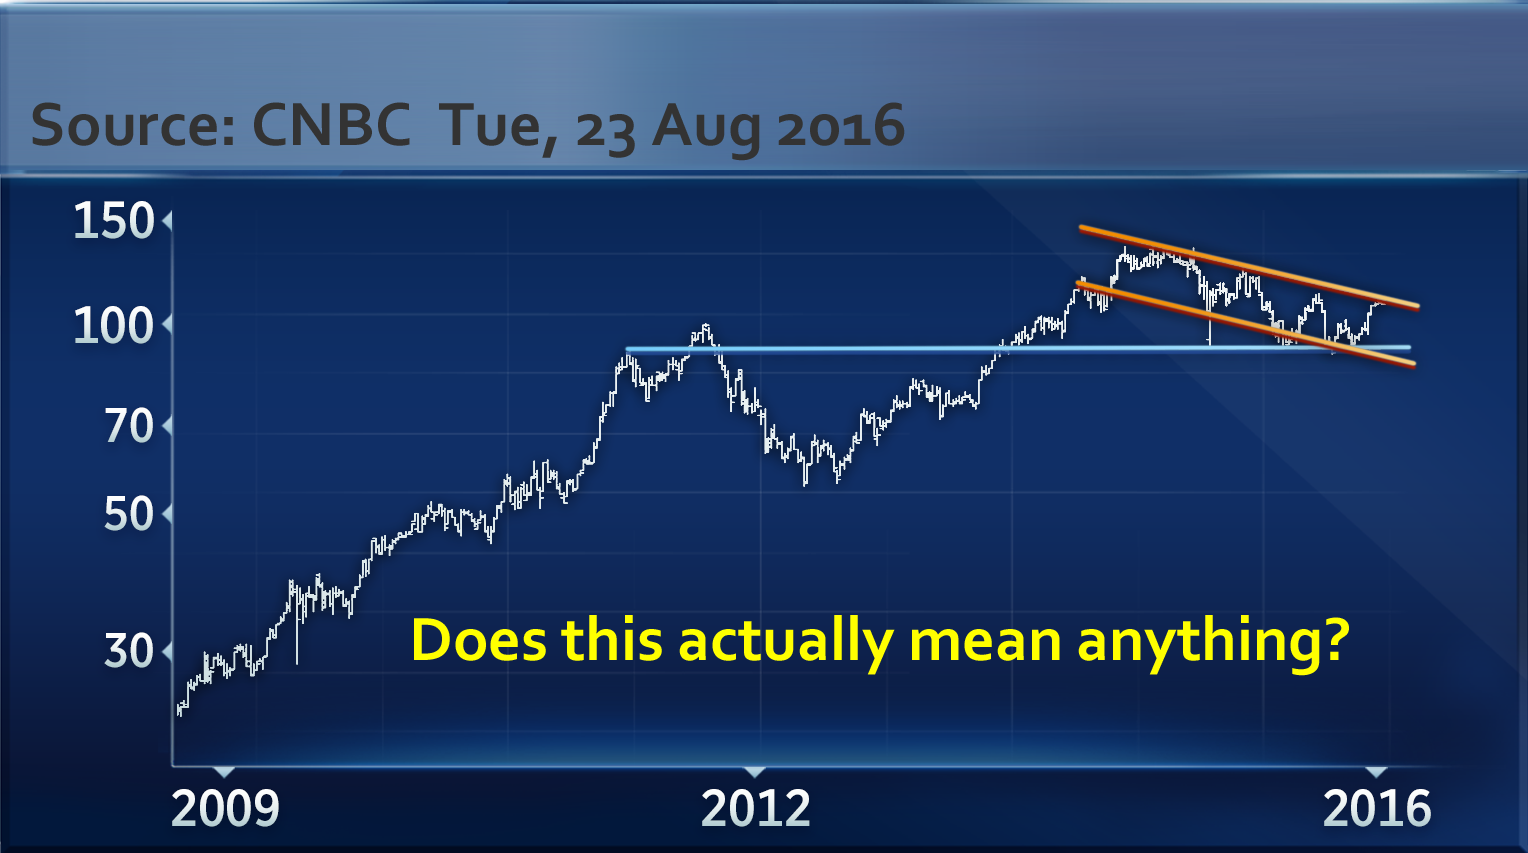
Charting isn't simply a collection of a few trend charts, or a few indicators that work in one example. No matter how many chart patterns are drawn, it's just a chart, at one specific time -- it really is.That's why technical analysis can feel so close to being profitable for a trader -- we can see it with our own eyes in an example -- and we can do so much preparation work, but at the same time the results, well, they never quite match up to the expectation. Today, that changes.
Swing Trading Signals - Option Backtester With Technical Analysis
The goal is to create a portfolio of option trading backtests with alerts attached to them -- they don't have be triggered right at that moment, but they will. We don't have to stare at the screen all day, but rather use Trade Machine as the pattern recognition work horse to notify when the ideas become actionable.The Bullish Option Trade with Technical Analysis and Moving Averages in Applied Materials
We examine the result of a long out-of-the-money (strike price is set to the 40 delta) call option that is the closest to 14-days from expiration (using calendar days). But we follow three rules to test the swing trade:* Never Trade Earnings
That means the backtester never opens a trade between the "black out period" of two before through two-days after an earnings announcement.
* Use a technical analysis trigger to start the trade, if and only if these specific items are met:
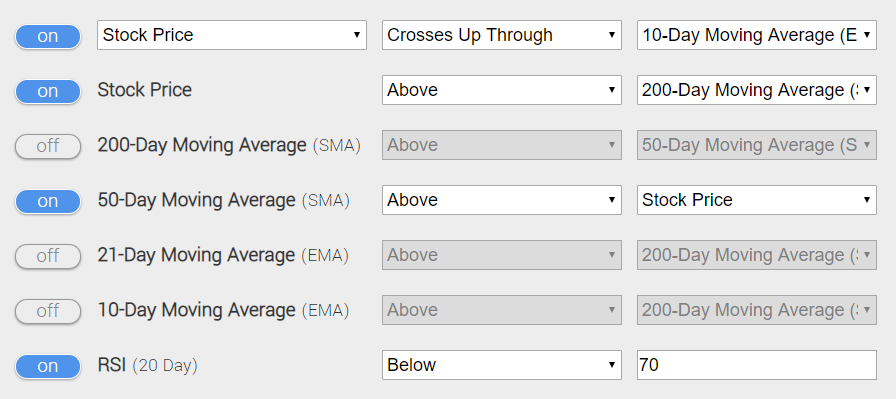
* Trigger on the precise day that the stock crosses the 10-day exponential moving average (EMA) -- that's a trigger of a momentum breakout right at that moment -- an uptrend.
* The stock is already above the 200-day simple moving average (SMA), which means that the stock is not in technical failure -- we're not after reversals. There is also some sentiment surrounding the 200-day moving average.
* Stock prices are below the 50-day SMA means that it has room to run to the upside.
* The Relative Strength Index (RSI), using 20-days, is below 70, so the stock isn't overbought -- there is little risk of being oversold with the prior signals in place.
Here it is in an image from Trade Machine -- only focus on the moving average and RSI settings where the filter is turned to "on.":
You can set an alert in Trade Machine®, which will track all of these moving parts for you, and message you when it triggers. In fact, you can do this with a portfolio of stocks for a portfolio of bullish and bearish triggers. Let Trade Machine do the work for you -- there's no need to stare at the screen.
* Finally, we set a very specific type of stop loss and limit:
* Use a 40% limit gain and a 60% stop loss.
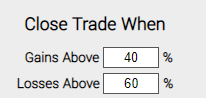
At the end of each day, the back-tester checks to see if the long call option is up 40% or down 60%. If it is, it closes the position.
Stock Option Backtester With Technical Analysis Results
Here are the results over the last three-years in Applied Materials:| AMAT: Long 40 Delta Call | |||
| % Wins: | 67% | ||
| Wins: 8 | Losses: 4 | ||
| % Return: | 312.3% | ||
Tap Here to See the Back-test
The mechanics of the TradeMachine® are that it uses end of day prices for every back-test entry and exit (every trigger).
Setting Expectations
While this strategy had an overall return of 312.3%, the trade details keep us in bounds with expectations:➡ The average percent return per trade was 26.78% for each 14-day period.
Checking the Moving Averages
You can check to see the values of all the moving averages discussed above with real-time daily prices, including live after hours prices, for AMAT by viewing the Pivot Points tab on www.CMLviz.com.Rigor to the Option Backtester, Swing Trading Technical Analysis and Backtesting
We compared this technical analysis trigger on the constituents of the Nasdaq 100 versus the results from the baseline. The baseline is simply owning calls and rolling them every two-weeks with the same stop and limit as introduced above (40% / 60%).Using rigorous technical analysis, as opposed to "that one chart that looked good that one time," we saw out performance over the 10-year period from March 2009 - March 2019, largely a bull market, as well as 2007-2009, the period which includes the Great Recession bear market. Further, we saw out performance in each sub period of one-year, two-years, three-years, and five-years.
Finally, the win rates by stock were also higher, as were the average winning trade return for every time period. Why look at one chart one time, when you can test technical set-ups across hundreds of thousands of charts at once?
Technical Analysis Back-testing More Time Periods in Applied Materials Inc
Now we can look at just the last year as well:| AMAT: Long 40 Delta Call | |||
| % Wins: | 100% | ||
| Wins: 2 | Losses: 0 | ||
| % Return: | 97.3% | ||
Tap Here to See the Back-test
We're now looking at 97.3% returns, on 2 winning trades and 0 losing trades.
➡ The average percent return over the last year per trade was 53.25% for each 14-day period.
Why This Matters
You can do this. Tap here to use technical analysis with pattern recognition.Risk Disclosure
Past performance is not an indication of future results.
Trading futures and options involves the risk of loss. Please consider carefully whether futures or options are appropriate to your financial situation. Only risk capital should be used when trading futures or options. Investors could lose more than their initial investment.
Past results are not necessarily indicative of future results. The risk of loss in trading can be substantial, carefully consider the inherent risks of such an investment in light of your financial condition.
Please note that the executions and other statistics in this article are hypothetical, and do not reflect the impact, if any, of certain market factors such as liquidity and slippage.
You should read the Characteristics and Risks of Standardized Options.