


Pre-earnings Momentum Trade With a Technical Trigger in ASML Holding N.V.
ASML Holding N.V. (NASDAQ:ASML) : Pre-earnings Momentum Trade With a Technical Trigger
Date Published: 2018-12-29
Disclaimer
The results here are provided for general informational purposes, as a convenience to the readers. The materials are not a substitute for obtaining professional advice from a qualified person, firm or corporation.Preface
There is a bullish momentum pattern in tech gem ASML Holding N.V. (NASDAQ:ASML) stock 7 calendar days before earnings. Further, we use moving averages as a safety valve to try to avoid opening a bullish position while a stock is in a technical break down, like the fourth quarter of 2018.We will demonstrate the full details in a webinar (register here).
As of this writing, the next earnings date for ASML is forecast for 1-23-2019, but the date is not yet confirmed. 7-days before then would be 1-16-2019.
LOGIC
There can be a stock rise ahead of earnings on optimism, or upward momentum, that sets in the one-week before an earnings date. That phenomenon has been well documented by Capital market Laboratories in our seminal webinar on market patterns.We will examine the outcome of getting long a weekly call option in ASML Holding N.V. 7-days before earnings (using calendar days) and selling the call before the earnings announcement if and only if the stock price is above the 50-day simple moving average.
Here's the set-up in great clarity; again, note that the trade closes before earnings, so this trade does not make a bet on the earnings result.
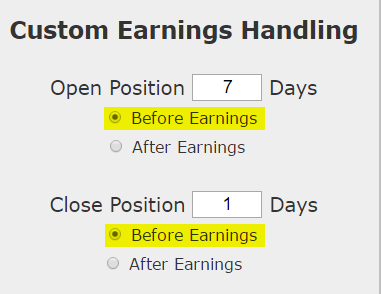
And here is the technical requirement -- note only one is "turned on," and that is the 50-day moving average requirement.:
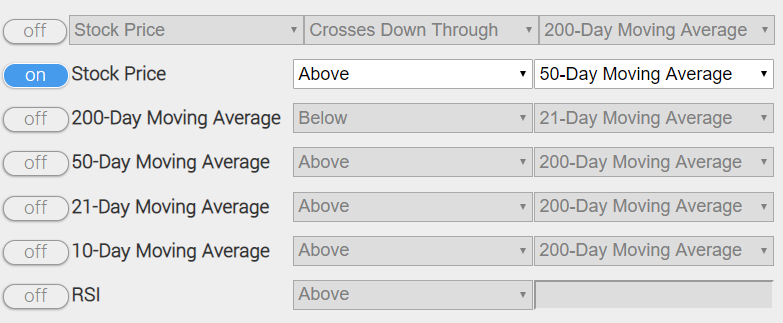
Here's a visual representation, where the stock price 7-days before earnings (circled) is above the 50-day moving average (black line), and therefore triggers a back-test.
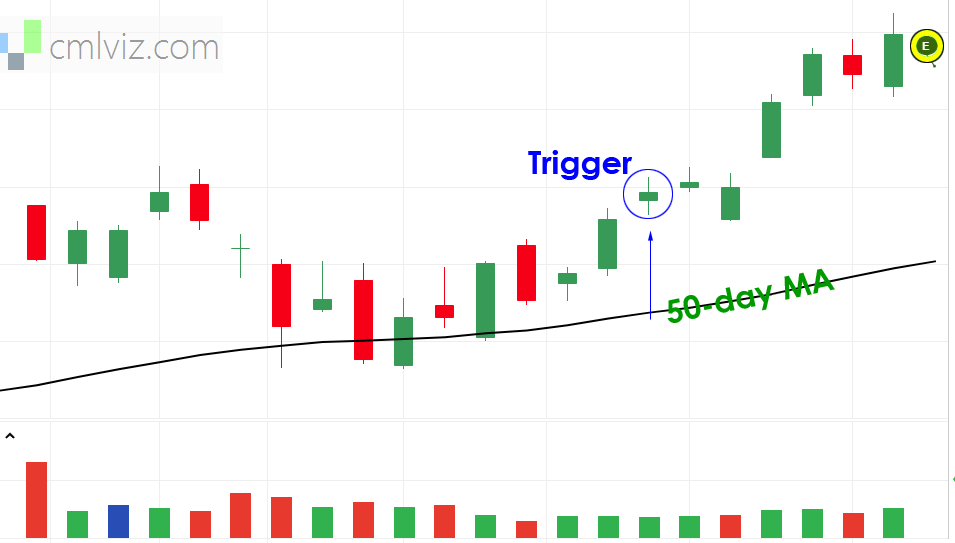
If the stock price fails the technical requirement, it's fine, we just put a pin in it and check next quarter.
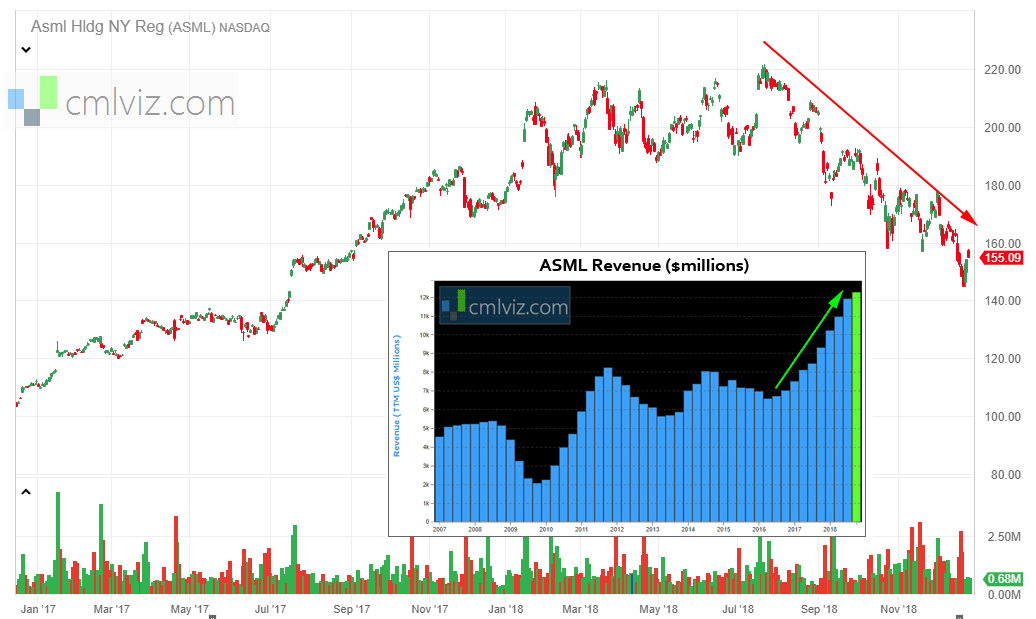
Finally, here is a look at a two-year stock chart for ASML and the 10-year revenue chart is is super imposed on the bottom.
RISK MANAGEMENT
We can add another layer of risk management to the back-test by instituting and 40% stop loss and a 40% limit gain. Here is that setting: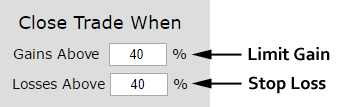
In English, at the close of each trading day we check to see if the long option is either up or down 40% relative to the open price. If it was, the trade was closed.
RESULTS
Here are the results over the last three-years in ASML Holding N.V.:| ASML: Long 40 Delta Call | |||
| % Wins: | 89% | ||
| Wins: 8 | Losses: 1 | ||
| % Return: | 566.6% | ||
The mechanics of the TradeMachine® Stock Option Backtester are that it uses end of day prices for every back-test entry and exit (every trigger).
Track this trade idea. Get alerted for ticker `ASML` 7 days before earnings
Notice that while this is a 3-year back-test and we would expect four times that many earnings triggers (4 earnings per year), the technical requirement using the 50-day moving average has avoided 3 pre-earnings attempts. In other words -- it's working.
We see a 566.6% return, testing this over the last 9 earnings dates in ASML Holding N.V.. That's a total of just 63 days (7-days for each earnings date, over 9 earnings dates).
Setting Expectations
While this strategy had an overall return of 566.6%, the trade details keep us in bounds with expectations:➡ The average percent return per trade was 85.38%.
Checking the Moving Average
You can check to see if the 50-day MA for ASML is above or below the current stock price by using the Pivot Points tab on www.CMLviz.com.Is This Just Because Of a Bull Market?
It's a fair question to ask if these returns are simply a reflection of a bull market rather than a successful strategy. It turns out that this phenomenon of pre-earnings optimism also worked very well during 2007-2008, when the S&P 500 collapsed into the "Great Recession."
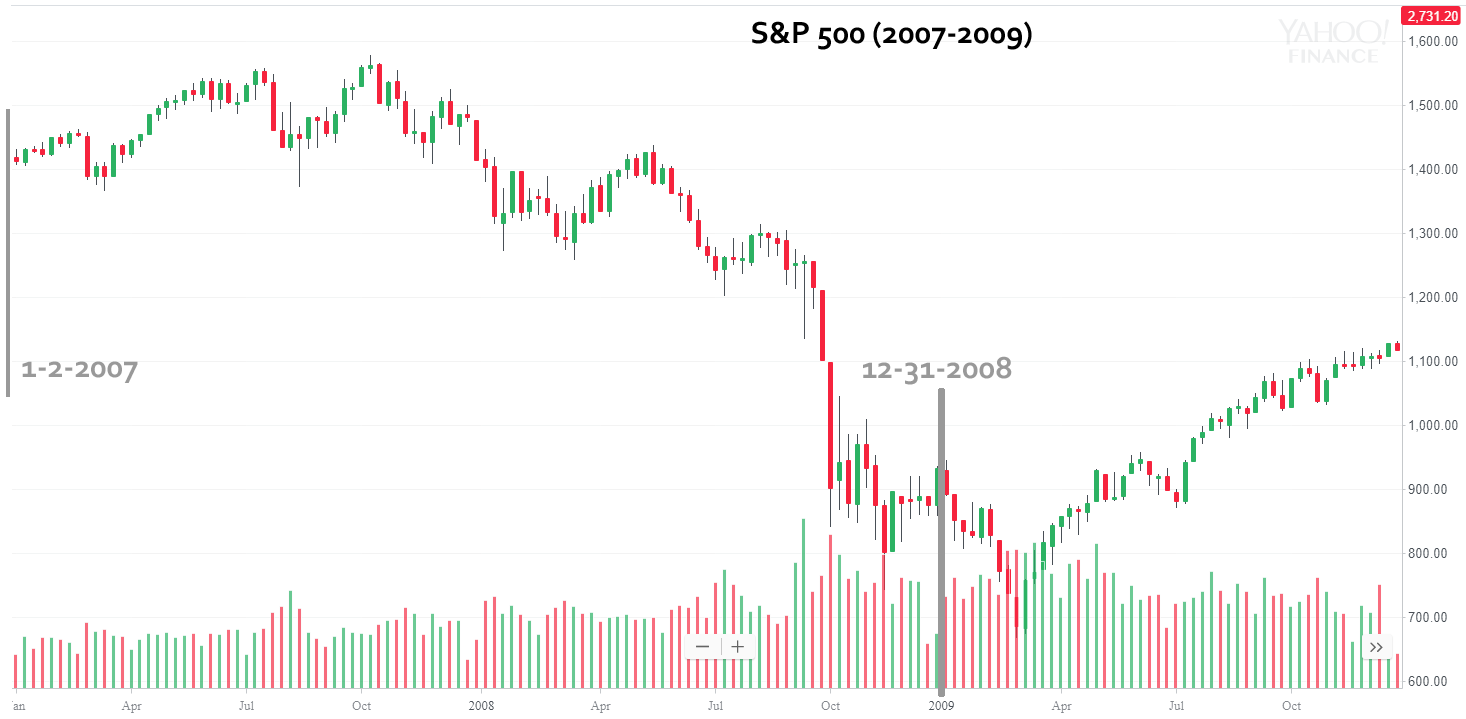
The average return for this strategy, by stock, using the Nasdaq 100 and Dow 30 as the study group, saw a 45.3% return over those 2-years. And, of course, these are just 8 trades per stock, each lasting 7 days.
* Yes. We are empirical.
* Yes, you are better than the rest now that you know this.
* Yes, you are powerful for it.
Back-testing More Time Periods in ASML Holding N.V.
Now we can look at just the last year as well:
| ASML: Long 40 Delta Call | |||
| % Wins: | 100.00% | ||
| Wins: 3 | Losses: 0 | ||
| % Return: | 419.8% | ||
We're now looking at 419.8% returns, on 3 winning trades and 0 losing trades.
➡ The average percent return over the last year per trade was 179.75%.
WHAT HAPPENED
This is how people profit from the option market, its empirical testing, not luck. Trade Machine gives you the capacity to trade beyond luck.Tap here to see it for yourself
Risk Disclosure
You should read the Characteristics and Risks of Standardized Options.
Past performance is not an indication of future results.
Trading futures and options involves the risk of loss. Please consider carefully whether futures or options are appropriate to your financial situation. Only risk capital should be used when trading futures or options. Investors could lose more than their initial investment.
Past results are not necessarily indicative of future results. The risk of loss in trading can be substantial, carefully consider the inherent risks of such an investment in light of your financial condition.
Please note that the executions and other statistics in this article are hypothetical, and do not reflect the impact, if any, of certain market factors such as liquidity and slippage.