Activision Blizzard Inc, ATVI, earnings, before, stock
Preface
The months of September and October often times bring volatility -- which is a less scary way of saying, stocks can go down abruptly, although they do historically recover by the end of the year, if not sooner.
Activision Blizzard Inc (NASDAQ:ATVI) is one of the many newly found tech darlings but instead of looking at a trade that bets on optimism (bullishness) ahead of earnings, we have created a new scan for TradeMachine™ members that does not rely on stock direction at all. It's a reminder that we do not need a bull market to persist in order to find strong option strategies. It's this type of strategy that we want to focus on for ATVI.
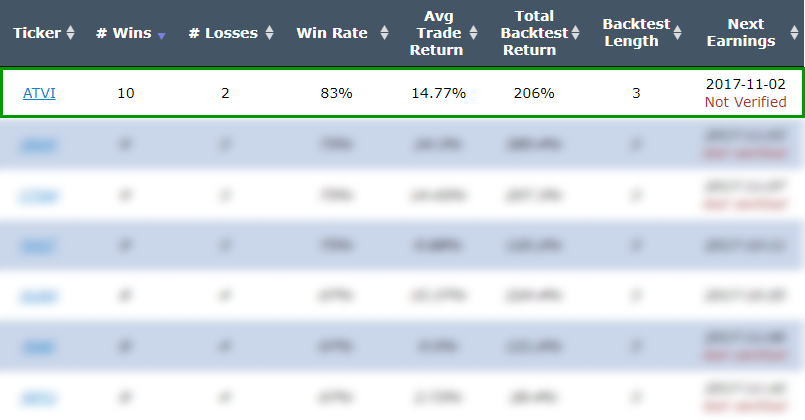
This approach has returned 206.0% with a total holding period of just 156 days, or a annualized rate of 482.0%. That time period has seen 10 winners and 2 losers ahead of earnings. Now that's worth looking into.
Activision usually releases earnings in early November, so two-weeks before then would put us in mid October -- let's say about 3-weeks from now.
The Trade Before Earnings: When it Works
We have looked at pre-earnings straddles before, but it was a very short-term window that we investigated -- namely six calendar days. In this new scan, we want to back-test buying an at the money straddle 14-days before earnings, and then sell that straddle just before earnings.
The goal of this type of trade is to benefit from a unique and short time frame when the stock might move 'a lot', either due to earnings anxiety (stock drops before earnings) or earnings optimism (stock rises before earnings), but taking no actual earnings risk.
If the stock is volatile during this period, this generally is a winning strategy, if it does not move, this strategy will likely not be profitable and the complete back-test below discusses that possibility.
Here is the setup:
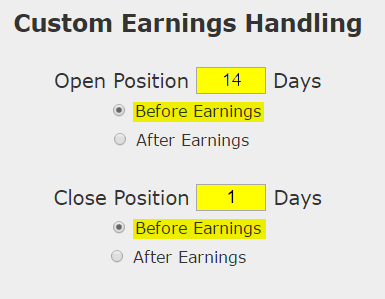
We are testing opening the position 14 calendar days before earnings and then closing the position 1 day before earnings. This is not making any earnings bet. This is not making any stock direction bet.
Once we apply that simple rule to our back-test, we run it on an at-the-money straddle:
RISK MANAGEMENT
We can add another layer of risk management to the back-test by instituting and 40% stop loss and a 40% limit gain. If the stock doesn't move a lot during this period and the options begin to decay in value, a stop loss can prevent a total loss.
On the flip side, if the stock does move in one direction or another enough, the trade can be closed early for a profit. Here are those settings:

In English, at the close of each trading day we check to see if the total position is either up or down 40% relative to the open price. If it was, the trade was closed.
Trade Discovery
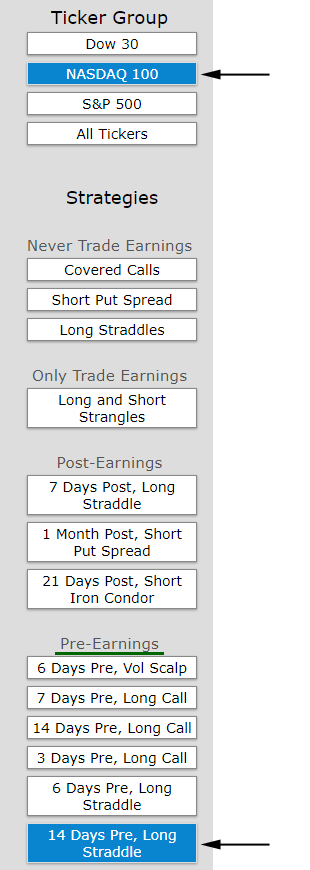
We want to focus on liquid names and those that have garnered a lot of interest. So, we limited our scan to the tech heavy Nasdaq 100, looked at the '14 Days Pre-earnings Straddle,' and then sorted by the number of wins.
Atop that list sits the gaming tech darling Activision. Here are the scan results:
Returns
If we did this long at-the-money straddle in Activision Blizzard Inc (NASDAQ:ATVI) over the last three-years but only held it before earnings we get these results:
Tap Here to See the Back-test
We see a 206.0% return, testing this over the last 12 earnings dates in Activision Blizzard Inc. That's a total of just 156 days (13 days for each earnings date, over 12 earnings dates).
We can also see that this strategy hasn't been a winner all the time, rather it has won 10 times and lost 2 times, for a 83% win-rate.
Setting Expectations
While this strategy has an overall return of 206.0%, the trade details keep us in bounds with expectations:
➡ The average percent return per trade was 14.77% over 13-days.
But this is our favorite part of the back-test results:
➡ The average percent return per winning trade was 19.2% over 13-days.
➡ The average percent return per losing trade was -7.1% over 13-days.
Option Trading in the Last Year
We can also look at the last year of earnings releases and examine the results:
In the latest year this pre-earnings option trade has 4 wins and lost 0 times and returned 69.8%.
➡ Over just the last year, the average percent return per trade was 16.9% for each 13-day trade.
Stock Chart
A two-year stock return chart illustrates the trade rationale:
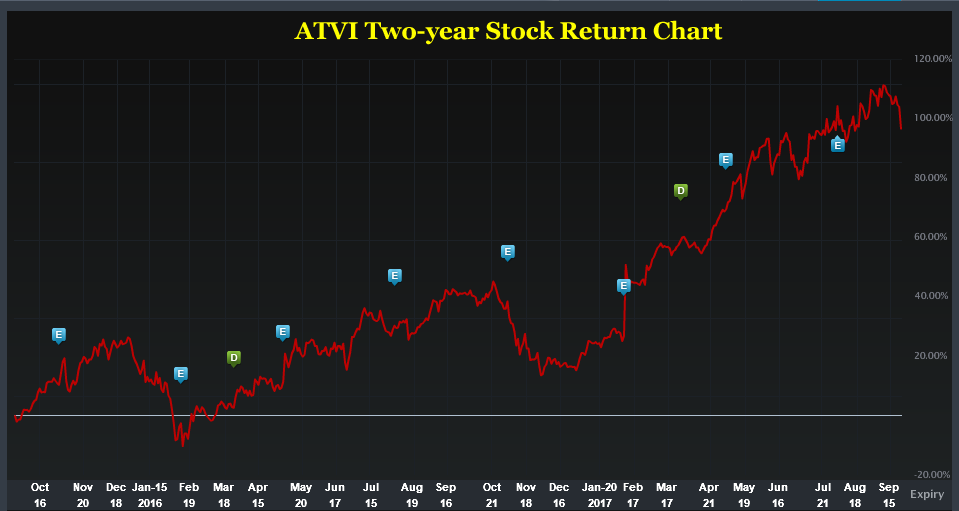
We see two phenomena:
(1) The stock has rallied hard over the last two-years.
(2) The stock has been volatile in the two-week period before earnings (the blue "E" icons represent earnings dates)
WHAT HAPPENED
This is it -- this is how people profit from the option market -- finding trading opportunities that avoid earnings risk and work equally well during a bull or bear market.
To see how to do this for any stock we welcome you to watch this quick demonstration video:
Tap Here to See the Tools at Work
Thanks for reading.
Risk Disclosure
You should read the Characteristics and Risks of Standardized Options.
Past performance is not an indication of future results.
Trading futures and options involves the risk of loss. Please consider carefully whether futures or options are appropriate to your financial situation. Only risk capital should be used when trading futures or options. Investors could lose more than their initial investment.
Past results are not necessarily indicative of future results. The risk of loss in trading can be substantial, carefully consider the inherent risks of such an investment in light of your financial condition.
Side-Stepping Stock Direction Risk in Option Trading Before Earnings in Activision Blizzard Inc

Activision Blizzard Inc (NASDAQ:ATVI) : Side-Stepping Stock Direction Risk in Option Trading Before Earnings
Date Published: 2017-09-25Author: Ophir Gottlieb
Preface
The months of September and October often times bring volatility -- which is a less scary way of saying, stocks can go down abruptly, although they do historically recover by the end of the year, if not sooner.
Activision Blizzard Inc (NASDAQ:ATVI) is one of the many newly found tech darlings but instead of looking at a trade that bets on optimism (bullishness) ahead of earnings, we have created a new scan for TradeMachine™ members that does not rely on stock direction at all. It's a reminder that we do not need a bull market to persist in order to find strong option strategies. It's this type of strategy that we want to focus on for ATVI.
This approach has returned 206.0% with a total holding period of just 156 days, or a annualized rate of 482.0%. That time period has seen 10 winners and 2 losers ahead of earnings. Now that's worth looking into.
Activision usually releases earnings in early November, so two-weeks before then would put us in mid October -- let's say about 3-weeks from now.
The Trade Before Earnings: When it Works
We have looked at pre-earnings straddles before, but it was a very short-term window that we investigated -- namely six calendar days. In this new scan, we want to back-test buying an at the money straddle 14-days before earnings, and then sell that straddle just before earnings.
The goal of this type of trade is to benefit from a unique and short time frame when the stock might move 'a lot', either due to earnings anxiety (stock drops before earnings) or earnings optimism (stock rises before earnings), but taking no actual earnings risk.
If the stock is volatile during this period, this generally is a winning strategy, if it does not move, this strategy will likely not be profitable and the complete back-test below discusses that possibility.
Here is the setup:

We are testing opening the position 14 calendar days before earnings and then closing the position 1 day before earnings. This is not making any earnings bet. This is not making any stock direction bet.
Once we apply that simple rule to our back-test, we run it on an at-the-money straddle:
RISK MANAGEMENT
We can add another layer of risk management to the back-test by instituting and 40% stop loss and a 40% limit gain. If the stock doesn't move a lot during this period and the options begin to decay in value, a stop loss can prevent a total loss.
On the flip side, if the stock does move in one direction or another enough, the trade can be closed early for a profit. Here are those settings:

In English, at the close of each trading day we check to see if the total position is either up or down 40% relative to the open price. If it was, the trade was closed.
Trade Discovery
We want to focus on liquid names and those that have garnered a lot of interest. So, we limited our scan to the tech heavy Nasdaq 100, looked at the '14 Days Pre-earnings Straddle,' and then sorted by the number of wins.

Atop that list sits the gaming tech darling Activision. Here are the scan results:

Returns
If we did this long at-the-money straddle in Activision Blizzard Inc (NASDAQ:ATVI) over the last three-years but only held it before earnings we get these results:
| ATVI Long At-the-Money Straddle |
|||
| % Wins: | 83.33% | ||
| Wins: 10 | Losses: 2 | ||
| % Return: | 206.0% | ||
Tap Here to See the Back-test
We see a 206.0% return, testing this over the last 12 earnings dates in Activision Blizzard Inc. That's a total of just 156 days (13 days for each earnings date, over 12 earnings dates).
We can also see that this strategy hasn't been a winner all the time, rather it has won 10 times and lost 2 times, for a 83% win-rate.
Setting Expectations
While this strategy has an overall return of 206.0%, the trade details keep us in bounds with expectations:
➡ The average percent return per trade was 14.77% over 13-days.
But this is our favorite part of the back-test results:
➡ The average percent return per winning trade was 19.2% over 13-days.
➡ The average percent return per losing trade was -7.1% over 13-days.
Option Trading in the Last Year
We can also look at the last year of earnings releases and examine the results:
| ATVI Long At-the-Money Straddle |
|||
| % Wins: | 100.00% | ||
| Wins: 4 | Losses: 0 | ||
| % Return: | 69.8% | ||
In the latest year this pre-earnings option trade has 4 wins and lost 0 times and returned 69.8%.
➡ Over just the last year, the average percent return per trade was 16.9% for each 13-day trade.
Stock Chart
A two-year stock return chart illustrates the trade rationale:

We see two phenomena:
(1) The stock has rallied hard over the last two-years.
(2) The stock has been volatile in the two-week period before earnings (the blue "E" icons represent earnings dates)
WHAT HAPPENED
This is it -- this is how people profit from the option market -- finding trading opportunities that avoid earnings risk and work equally well during a bull or bear market.
To see how to do this for any stock we welcome you to watch this quick demonstration video:
Tap Here to See the Tools at Work
Thanks for reading.
Risk Disclosure
You should read the Characteristics and Risks of Standardized Options.
Past performance is not an indication of future results.
Trading futures and options involves the risk of loss. Please consider carefully whether futures or options are appropriate to your financial situation. Only risk capital should be used when trading futures or options. Investors could lose more than their initial investment.
Past results are not necessarily indicative of future results. The risk of loss in trading can be substantial, carefully consider the inherent risks of such an investment in light of your financial condition.


