


A Buy the Dip Stock Trigger in Beyond Meat Inc
Beyond Meat Inc (NASDAQ:BYND) and Technical Analysis: Buy the Dip Trigger to Get Long: Bollinger Bands and RSI
Date Published: 2022-03-20
Disclaimer
The results here are provided for general informational purposes from the CMLviz Trade Machine Stock Option Backtester as a convenience to the readers. The materials are not a substitute for obtaining professional advice from a qualified person, firm or corporation.Preface: Using Charts and Computations Simultaneously to Buy the Dip
"Buying the Dip" takes on many forms in the world of technical analysis, but following market mantras is insufficient for a trader looking to be data driven and precise.Rather than "draw lines on that chart that time," we tested a specific "Buy the Dip" set-up, across a decade and half of data and tens of thousands of backtests.
In this case we identified two requirements. This doesn't mean it's a trigger now, it means when it has happened, that has led to historically good returns, and in particular, good risk adjusted returns.
These are the two technical requirements:
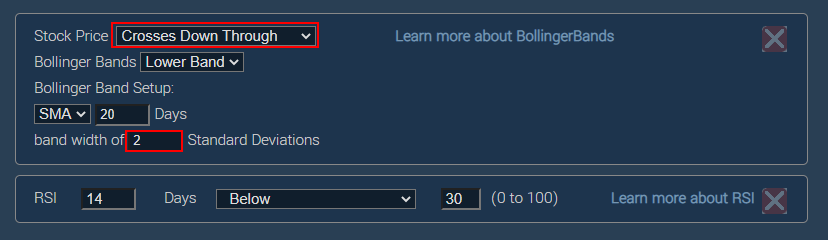
Here is the set-up in Stock TradeMachine®.
Translated from an image into words:
1. Wait until the day that the stock price dips below the bottom band of a two standard deviation Bollinger Band.
2. The 14-day RSI is below 30; this is a common requirement for an oversold condition.
This strategy is a buy the dip that does not wait for technical recovery, but instead looks to win if the stock rallies in the short- to intermediate-term. For this example we use a 22-trading day holding period (22 trading days is about one calendar month) after the trigger.
After rigorous testing over multiple time periods including, but not limited to, the 13-year period from January 2007 through March 2020, and the Great Recession (September 2007 through March 2009) and over 100,000 back-tests, today we demonstrate the technical conditions that have provided a strong intermediate-term bullish trigger for Beyond Meat Inc (NASDAQ:BYND) .
If you 're not making use of computing power to examine patterns, then the algorithms are using you to profit. That's it.
Why not become an algorithm yourself, and take back the edge that is rightly yours from the Wall Street bots -- Tap here to finally find the trading outcomes from charts you've been looking for. It's free for a limited time.
CML Efficiency Score™
At Capital Market Laboratories (CMLviz), we created a standardized reward to risk measurement for backtests called the CML Efficiency Score™ (ES).The ES takes the average trade return from each triggered backtest (the 'reward') and divides it by the maximum drawdown (the risk).
The max drawdown is measured as the largest open-to-trough decline in the value of a backtest for each new opening trade.
Our view is that an CML Efficiency Score above 0.8 is very good and above 1.0 is excellent. A number above 1.0 indicates that the average return is in fact larger than the maximum realized loss.
Do technical analysis on purpose with Stock TradeMachine® (for free).
5-Year Backtest Results: A Bollinger Collapse and RSI in Beyond Meat Inc
Here are the results of a long stock position held for 22 trading days tested over the last 5-years in Beyond Meat Inc once the two technical requirements have been met:| BYND: Long Stock for One-Month | |||
| % Wins: | 75% | ||
| Wins: 3 | Losses: 1 | ||
| CML Efficiency Score™: | 1.42 | ||
| Return: | 79.2% | ||
Tap Here to See the Back-test
The mechanics of the Stock TradeMachine® are that it uses end of day prices for every back-test entry and exit (every trigger).
We see 3 wins and 1 losses with a total backtest return of 79.2%.
We note an CML Efficiency Score™ above 1.00, which is excellent.
One-Year Backtest Results: A Bollinger Collapse and RSI in Beyond Meat Inc
Here are the results of that same trigger, but focused one just the last year:| BYND: Long Stock for One-Month | |||
| % Wins: | 100% | ||
| Wins: 1 | Losses: 0 | ||
| CML Efficiency Score™: | 12.79 | ||
Tap Here to See the Back-test
We note an CML Efficiency Score™ above 1.00, which is excellent.
Next Steps
If you use Technical Analysis, please do it right. This is free, so: Tap here to try Stock TradeMachine®.Risk Disclosure
Past results are not necessarily indicative of future results. The risk of loss in trading can be substantial, carefully consider the inherent risks of such an investment in light of your financial condition.
Please note that the executions and other statistics in this article are hypothetical, and do not reflect the impact, if any, of certain market factors such as liquidity and slippage.