Cisco Systems, Inc.
XNAS:CSCO
120.42
+1.78
(+1.50%)
7:59:48 PM EDT: $120.55 +0.13 (+0.11%)


Cisco Systems Inc, CSCO, mammoth, technical, trading, trade, results, cmlviz

Disclaimer
The results here are provided for general informational purposes, as a convenience to the readers. The materials are not a substitute for obtaining professional advice from a qualified person, firm or corporation.
LEDE
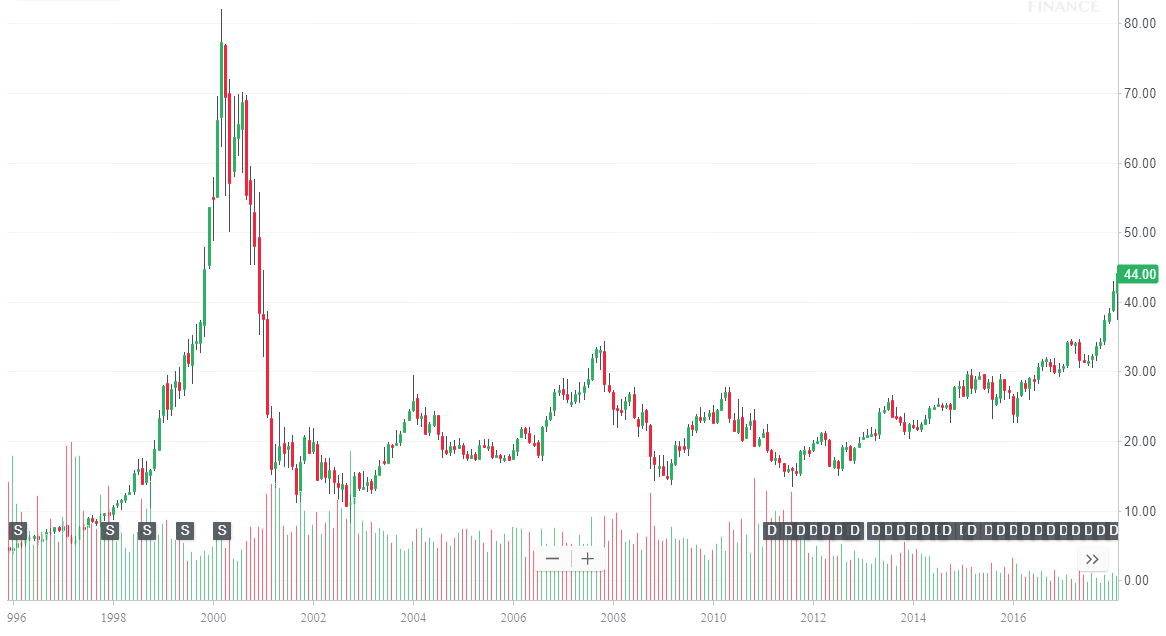
Cisco Systems Inc (NASDAQ:CSCO) just blew out earnings and is now trading at 17-year high, but still more than 50% lower than its rarefied price back in the dot com bubble.
The earnings beat has pushed its technicals into an interesting zone with respect to the proprietary model built by CMLviz. As of right now, it scores a 7.5, with a 9.9 being the trigger point for a mammoth model technical break out. While it is has not hit the tested threshold yet, you can keep up to date on the mammoth score intra-day by using the Trade Machine® Pro Scanner.
Preface
There comes a point, after all the charts that are shared on CNBC and social media, when we simply must examine, in truth, whether technical trading has actually worked in the past, and if so, which signal, how is it generated, and what are the historical results -- explicitly?
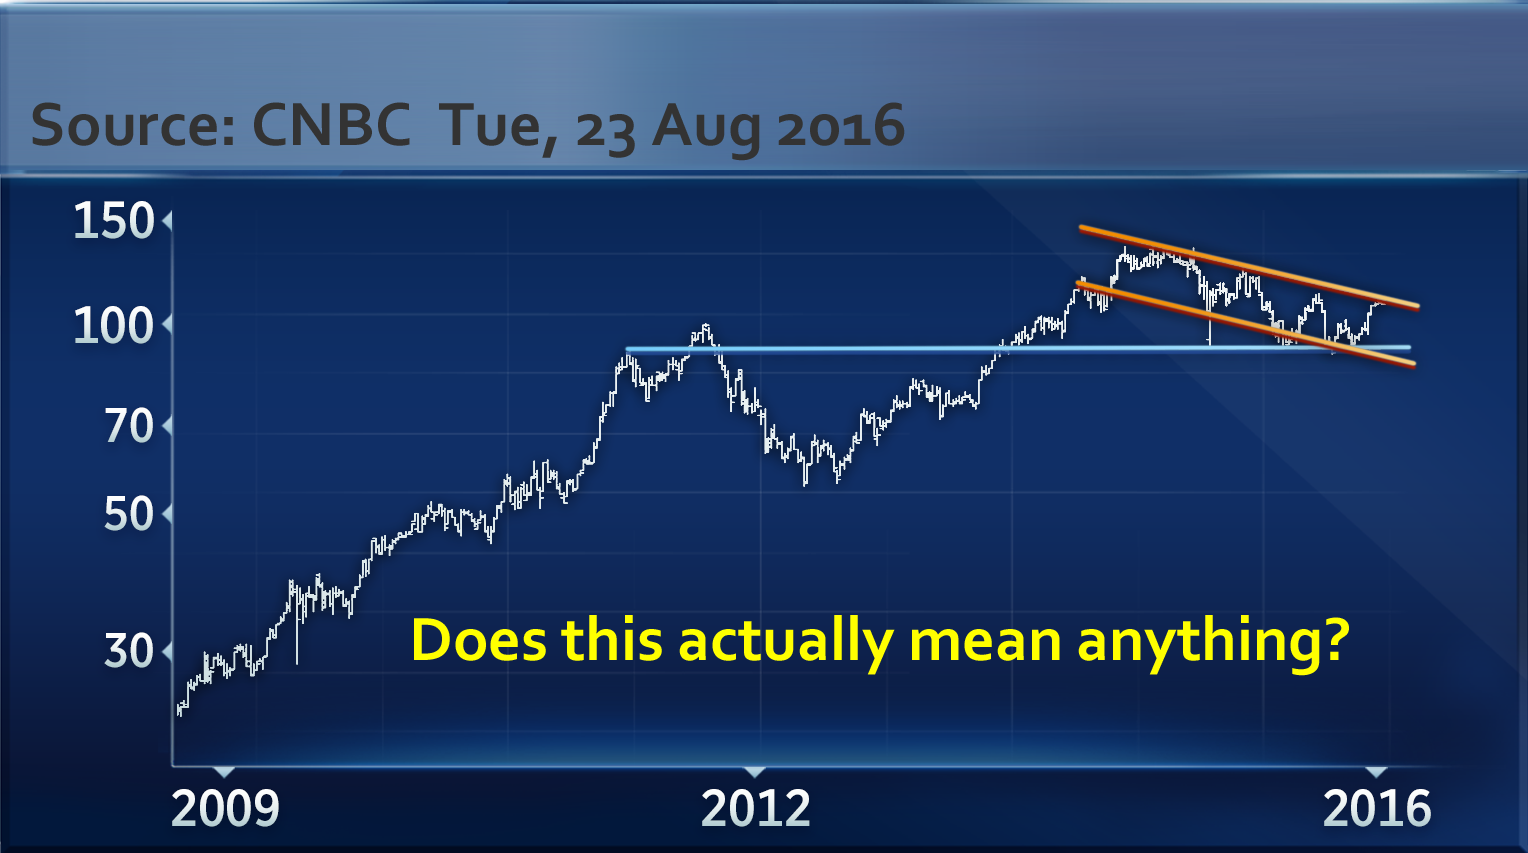
We are looking for answers that are empirical and explicit, not just lines on a chart, not one example that looks good.
ANSWERS: Cisco Systems Inc (NASDAQ:CSCO) CMLviz Mammoth Technical Trigger
The idea behind all of this, and all technical analysis, is that past price behavior and key levels are watched by so many people, that patterns can repeat, and if those patterns can be identified ahead of time, they can create higher probability trades than those entered without them.
The breakout from the CMLviz Mammoth attempts to find these bursts -- based on tens of thousands of historical trades and machine learning.
The goal, of course, is to find these breakouts before they occur and to scan the market for the best historical performers.
Rules
* Open the long 70 delta call (in the money call) on the day the CMLviz Mammoth has been triggered and coincides with upside momentum of at least a 1% up move.
* Close the call at expiration.
* Use the options closest to 14 days from expiration.
* Always avoid earnings -- irrespective of the trigger and momentum, this back-test closes 2 trading days before a scheduled earnings date.
EXPLICIT RESULTS
Owning the 70 delta call in Cisco Systems Inc (NASDAQ:CSCO) over the last 2-years but only after a CML Mammoth was triggered had produced these back-tested returns:
Check it out Yourself: Tap Here to See the Back-test
The mechanics of these back-tests and everything in the TradeMachine™ are such that it uses end of day (EOD) prices for every trigger, both entry and exit.
We see a 103% back-test return, which is based on just 4 trades in Cisco Systems Inc. A bullish signal triggered from the CML Mammoth doesn't necessarily happen often, but it is designed to objectively pinpoint the beginning of a short-term period, using moving averages, momentum, and volatility oscillators, when a stock is likely to move higher.
It's a model based on several indicators rolled into one signal and is based on probabilities, not absolutes, so it won't work all the time. The full details, including not only the empirical modeling but also the full closed form equation, and live scans for breakouts, are all available to CML Trade Machine members.
Looking at Averages
The overall return was 103%; but the trade statistics tell us more with average trade results:
➡ The average return per trade was 30.9% over a 14-day period.
Technical Details
For the details about the CML Mammoth model, what is included in it (exactly), how it works, and when it's triggered, using Trade Machine you can learn about scientific technical trading from the link (which leads to a short video).
WHAT HAPPENED
If you want to see the Mammoth indicator live in action, there's only one place to try it. This is one way people profit from the option market -- whether it's technical analysis, momentum trading or non-directional option trading. Take a reasonable idea or hypothesis, test it, and apply lessons learned.
We welcome you to watch this quick demonstration video:
Tap Here to See the Tools at Work
Risk Disclosure
You should read the Characteristics and Risks of Standardized Options.
Past performance is not an indication of future results.
Trading futures and options involves the risk of loss. Please consider carefully whether futures or options are appropriate to your financial situation. Only risk capital should be used when trading futures or options. Investors could lose more than their initial investment.
Past results are not necessarily indicative of future results. The risk of loss in trading can be substantial, carefully consider the inherent risks of such an investment in light of your financial condition.
Please note that the executions and other statistics in this article are hypothetical, and do not reflect the impact, if any, of certain market factors such as liquidity and slippage.
Cisco Systems Inc Is on the Verge of a Serious Technical Breakout
Cisco Systems Inc (NASDAQ:CSCO) : Get Serious About Technical Analysis: How The CMLviz 'Mammoth' Has Consistently Performed
Date Published: 2018-02-15Author: Ophir Gottlieb
Disclaimer
The results here are provided for general informational purposes, as a convenience to the readers. The materials are not a substitute for obtaining professional advice from a qualified person, firm or corporation.
LEDE
Cisco Systems Inc (NASDAQ:CSCO) just blew out earnings and is now trading at 17-year high, but still more than 50% lower than its rarefied price back in the dot com bubble.
The earnings beat has pushed its technicals into an interesting zone with respect to the proprietary model built by CMLviz. As of right now, it scores a 7.5, with a 9.9 being the trigger point for a mammoth model technical break out. While it is has not hit the tested threshold yet, you can keep up to date on the mammoth score intra-day by using the Trade Machine® Pro Scanner.
Preface
There comes a point, after all the charts that are shared on CNBC and social media, when we simply must examine, in truth, whether technical trading has actually worked in the past, and if so, which signal, how is it generated, and what are the historical results -- explicitly?
We are looking for answers that are empirical and explicit, not just lines on a chart, not one example that looks good.
ANSWERS: Cisco Systems Inc (NASDAQ:CSCO) CMLviz Mammoth Technical Trigger
The idea behind all of this, and all technical analysis, is that past price behavior and key levels are watched by so many people, that patterns can repeat, and if those patterns can be identified ahead of time, they can create higher probability trades than those entered without them.
The breakout from the CMLviz Mammoth attempts to find these bursts -- based on tens of thousands of historical trades and machine learning.
The goal, of course, is to find these breakouts before they occur and to scan the market for the best historical performers.
Rules
* Open the long 70 delta call (in the money call) on the day the CMLviz Mammoth has been triggered and coincides with upside momentum of at least a 1% up move.
* Close the call at expiration.
* Use the options closest to 14 days from expiration.
* Always avoid earnings -- irrespective of the trigger and momentum, this back-test closes 2 trading days before a scheduled earnings date.
EXPLICIT RESULTS
Owning the 70 delta call in Cisco Systems Inc (NASDAQ:CSCO) over the last 2-years but only after a CML Mammoth was triggered had produced these back-tested returns:
| CSCO Long 70 Delta Call Signal: CML Mammoth |
|||
| % Wins: | 100% | ||
| Wins: 4 | Losses: 0 | ||
| % Return: | 103% | ||
Check it out Yourself: Tap Here to See the Back-test
The mechanics of these back-tests and everything in the TradeMachine™ are such that it uses end of day (EOD) prices for every trigger, both entry and exit.
We see a 103% back-test return, which is based on just 4 trades in Cisco Systems Inc. A bullish signal triggered from the CML Mammoth doesn't necessarily happen often, but it is designed to objectively pinpoint the beginning of a short-term period, using moving averages, momentum, and volatility oscillators, when a stock is likely to move higher.
It's a model based on several indicators rolled into one signal and is based on probabilities, not absolutes, so it won't work all the time. The full details, including not only the empirical modeling but also the full closed form equation, and live scans for breakouts, are all available to CML Trade Machine members.
Looking at Averages
The overall return was 103%; but the trade statistics tell us more with average trade results:
➡ The average return per trade was 30.9% over a 14-day period.
Technical Details
For the details about the CML Mammoth model, what is included in it (exactly), how it works, and when it's triggered, using Trade Machine you can learn about scientific technical trading from the link (which leads to a short video).
WHAT HAPPENED
If you want to see the Mammoth indicator live in action, there's only one place to try it. This is one way people profit from the option market -- whether it's technical analysis, momentum trading or non-directional option trading. Take a reasonable idea or hypothesis, test it, and apply lessons learned.
We welcome you to watch this quick demonstration video:
Tap Here to See the Tools at Work
Risk Disclosure
You should read the Characteristics and Risks of Standardized Options.
Past performance is not an indication of future results.
Trading futures and options involves the risk of loss. Please consider carefully whether futures or options are appropriate to your financial situation. Only risk capital should be used when trading futures or options. Investors could lose more than their initial investment.
Past results are not necessarily indicative of future results. The risk of loss in trading can be substantial, carefully consider the inherent risks of such an investment in light of your financial condition.
Please note that the executions and other statistics in this article are hypothetical, and do not reflect the impact, if any, of certain market factors such as liquidity and slippage.