Fedex Corp
XNYS:FDX 4:00:00 PM EDT
321.02
+5.83
(+1.85%)
: $321.00 -0.02 (-0.01%)


FedEx Corporation, FDX, earnings, options, volatility, iron condor

LEDE
We've looked at a lot of momentum trades and we will get back on the trend when the new year turns, but for now, we will continue to look at year-end back-tests that are non-directional in nature.
This is a slightly advanced option trade that starts two calendar days after FedEx Corporation (NYSE:FDX) earnings and lasts for the 19 calendar days to follow, that has been a winner for the last 2 years.
FedEx has earnings due out on Tuesday 12-19-2017 after the market closes, according to our data provider Wall Street Horizon, and two days after that would be 12-21-2017 at the market close.
FedEx Corporation (NYSE:FDX) Earnings
For FedEx Corporation, irrespective of whether the earnings move was up or down, if we waited two full trading days after the stock move, and then sold a 3-week at out of the money iron condor (using weekly options closest to 21 days) at the close of trading of the second full day after earnings, the results were quite strong. This trade opens two calendar after earnings were announced to try to let the stock find equilibrium after the earnings announcement.
We can test this approach without bias with a custom option back-test. Here is our earnings set-up:
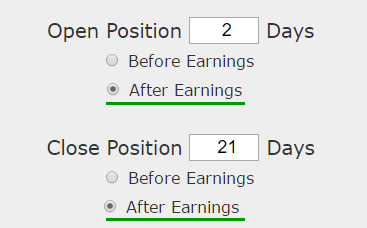
Rules
* Open the short iron condor two calendar days after earnings
* Close the iron condor 21 calendar days after earnings
* Use the options closest to 21 days from expiration (but at least 21-days).
And a note before we see the results: This is a straight down the middle volatility bet -- this trade wins if the stock is not volatile the three weeks following earnings and it will stand to lose if the stock is volatile.
RISK MANAGEMENT
RESULTS
If we sold this 35/15 delta iron condor in FedEx Corporation (NYSE:FDX) over the last two-years but only held it after earnings we get these results:
Tap Here to See the Back-test
We see a 338% return, testing this over the last 7 earnings dates in FedEx Corporation. That's a total of just 133 days (19 days for each earnings date, over 7 earnings dates).
We can also see that this strategy hasn't been a winner all the time, rather it has won 6 times and lost 1 time, for a 86% win-rate.
Setting Expectations
While this strategy had an overall return of 34.9%, the trade details keep us in bounds with expectations:
➡ The average percent return per trade was 37.2% over 19-days.
➡ The average percent return per winning trade was 46.1% over 19-days.
➡ The average percent return per losing trade was -16.5% over 19-days.
WHAT HAPPENED
Traders that have a plan guess less. This is how people profit from the option market. Take a reasonable idea or hypothesis, test it, and apply lessons learned. Sometimes that means using momentum or technical analysis. In this article, we examined non-directional positioning.
Tap Here to See the Tools at Work
Risk Disclosure
You should read the Characteristics and Risks of Standardized Options.
Past performance is not an indication of future results.
Trading futures and options involves the risk of loss. Please consider carefully whether futures or options are appropriate to your financial situation. Only risk capital should be used when trading futures or options. Investors could lose more than their initial investment.
Past results are not necessarily indicative of future results. The risk of loss in trading can be substantial, carefully consider the inherent risks of such an investment in light of your financial condition.
Please note that the executions and other statistics in this article are hypothetical, and do not reflect the impact, if any, of certain market factors such as liquidity and slippage.
How to Trade Options After Earnings in FedEx (FDX)
FedEx Corporation (NYSE:FDX) : The Volatility Option Trade After Earnings
Date Published: 2017-12-18Author: Ophir Gottlieb
LEDE
We've looked at a lot of momentum trades and we will get back on the trend when the new year turns, but for now, we will continue to look at year-end back-tests that are non-directional in nature.
This is a slightly advanced option trade that starts two calendar days after FedEx Corporation (NYSE:FDX) earnings and lasts for the 19 calendar days to follow, that has been a winner for the last 2 years.
FedEx has earnings due out on Tuesday 12-19-2017 after the market closes, according to our data provider Wall Street Horizon, and two days after that would be 12-21-2017 at the market close.
FedEx Corporation (NYSE:FDX) Earnings
For FedEx Corporation, irrespective of whether the earnings move was up or down, if we waited two full trading days after the stock move, and then sold a 3-week at out of the money iron condor (using weekly options closest to 21 days) at the close of trading of the second full day after earnings, the results were quite strong. This trade opens two calendar after earnings were announced to try to let the stock find equilibrium after the earnings announcement.
We can test this approach without bias with a custom option back-test. Here is our earnings set-up:
Rules
* Open the short iron condor two calendar days after earnings
* Close the iron condor 21 calendar days after earnings
* Use the options closest to 21 days from expiration (but at least 21-days).
And a note before we see the results: This is a straight down the middle volatility bet -- this trade wins if the stock is not volatile the three weeks following earnings and it will stand to lose if the stock is volatile.
RISK MANAGEMENT
RESULTS
If we sold this 35/15 delta iron condor in FedEx Corporation (NYSE:FDX) over the last two-years but only held it after earnings we get these results:
| FDX: Short 35 Delta / 15 Delta Iron Condor |
|||
| % Wins: | 85.7% | ||
| Wins: 6 | Losses: 1 | ||
| % Return: | 338% | ||
Tap Here to See the Back-test
We see a 338% return, testing this over the last 7 earnings dates in FedEx Corporation. That's a total of just 133 days (19 days for each earnings date, over 7 earnings dates).
We can also see that this strategy hasn't been a winner all the time, rather it has won 6 times and lost 1 time, for a 86% win-rate.
Setting Expectations
While this strategy had an overall return of 34.9%, the trade details keep us in bounds with expectations:
➡ The average percent return per trade was 37.2% over 19-days.
➡ The average percent return per winning trade was 46.1% over 19-days.
➡ The average percent return per losing trade was -16.5% over 19-days.
WHAT HAPPENED
Traders that have a plan guess less. This is how people profit from the option market. Take a reasonable idea or hypothesis, test it, and apply lessons learned. Sometimes that means using momentum or technical analysis. In this article, we examined non-directional positioning.
Tap Here to See the Tools at Work
Risk Disclosure
You should read the Characteristics and Risks of Standardized Options.
Past performance is not an indication of future results.
Trading futures and options involves the risk of loss. Please consider carefully whether futures or options are appropriate to your financial situation. Only risk capital should be used when trading futures or options. Investors could lose more than their initial investment.
Past results are not necessarily indicative of future results. The risk of loss in trading can be substantial, carefully consider the inherent risks of such an investment in light of your financial condition.
Please note that the executions and other statistics in this article are hypothetical, and do not reflect the impact, if any, of certain market factors such as liquidity and slippage.