GE Aerospace
XNYS:GE 4:00:00 PM EDT
341.19
+0.49
(+0.14%)
: $341.71 +0.52 (+0.15%)


General Electric Company, GE, risk, earnings, market, results, stock, straddle
Disclaimer
The results here are provided for general informational purposes, as a convenience to the readers. The materials are not a substitute for obtaining professional advice from a qualified person, firm or corporation.
Preface
General Electric's epic stock collapse presents a rare opportunity.
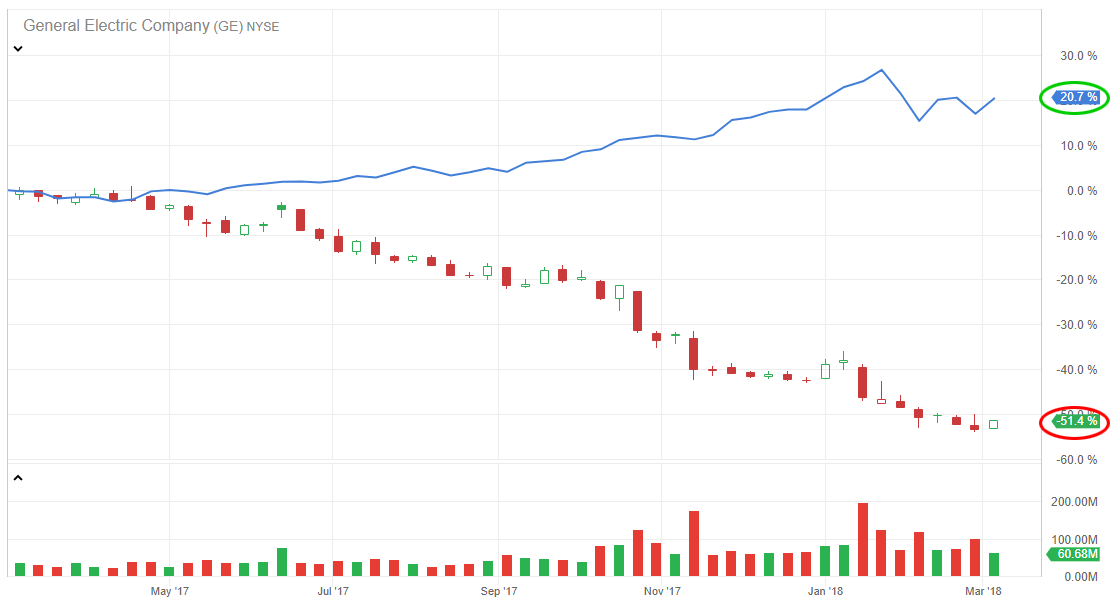
While the market has been in full bull mode, General Electric Company (NYSE:GE) has not been. In fact, the stock is totally collapsing. Here is an one-year chart with GE in the candles and the Dow Jones in the blue line. GE is down fully 51% in the last year as the Dow has risen over 20%.
The goal with this type of stock move is to find trades that expose risk in short-bursts of time, with out-sized historical gains relative to historical losses but do not take stock direction risk.
The Trade Before Earnings in General Electric Company
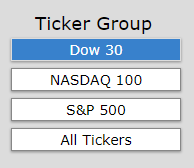
We scanned the Dow 30 for the 4-days pre-earnings long straddle using Trade Machine Pro®.
And here's what we found, when we sorted by average return:
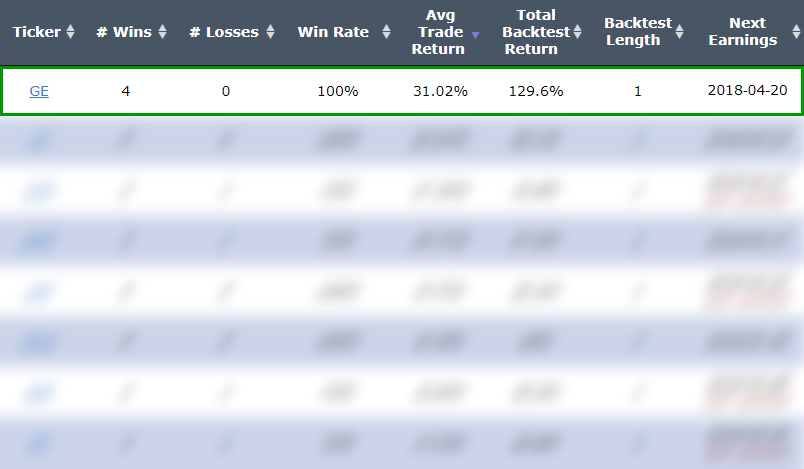
This is the best performing stock for this option strategy in the entire Dow Jones Industrial Average over the last year.
What's Going On
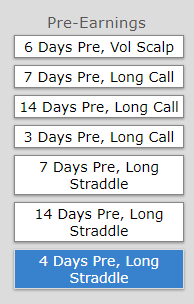
We examine the results of getting long a weekly at the money straddle 4-calendar days days before earnings, and then sell out of that position one-day before the actual release earnings.
Here is the setup:
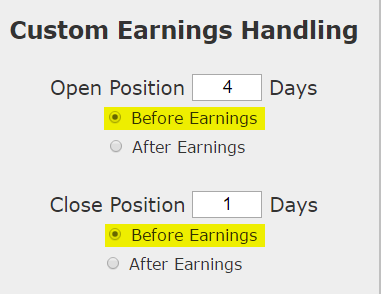
We are testing opening the position 4 calendar days pre-earnings event and then closing the straddle 1 day before earnings. This is not making any earnings bet. This is not making any stock direction bet.
Once we apply that simple rule to our back-test, we run it on an at-the-money straddle:
Returns
If we did this long at-the-money (also called '50-delta') straddle (using the options closest to one-week in expiration) in General Electric Company (NYSE:GE) over the last three-years but only held it before earnings we get these results:
In the latest year this pre-earnings option trade has 4 wins and lost 0 times and returned 129.6%.
The mechanics of the TradeMachine™ are that it uses end of day prices for every back-test entry and exit (every trigger).
Setting Expectations
While the total back-test return was 129%, we must look at the average return per trade.
➡ Over just the last year, the average percent return per trade was 31% over just 4-days each.
Tested Across Bull and Bear Markets
While many times we can identify strategies that work during a bull or a bear market, this strategy, when we tested it empirically, worked during both. Here are the specifics:
Using the Nasdaq 100 and the Dow 30 as our study group, here are the average total returns by stock for the bull market from 2012-2018 (January) and 2007-2009, which includes the bear market, and the wild 2009 -- where the S&P 500 bottomed in March and then ripped higher -- in other words, a highly volatile time in the market.
As a quick reminder, here is the 2007-2009 period for the S&P 500:
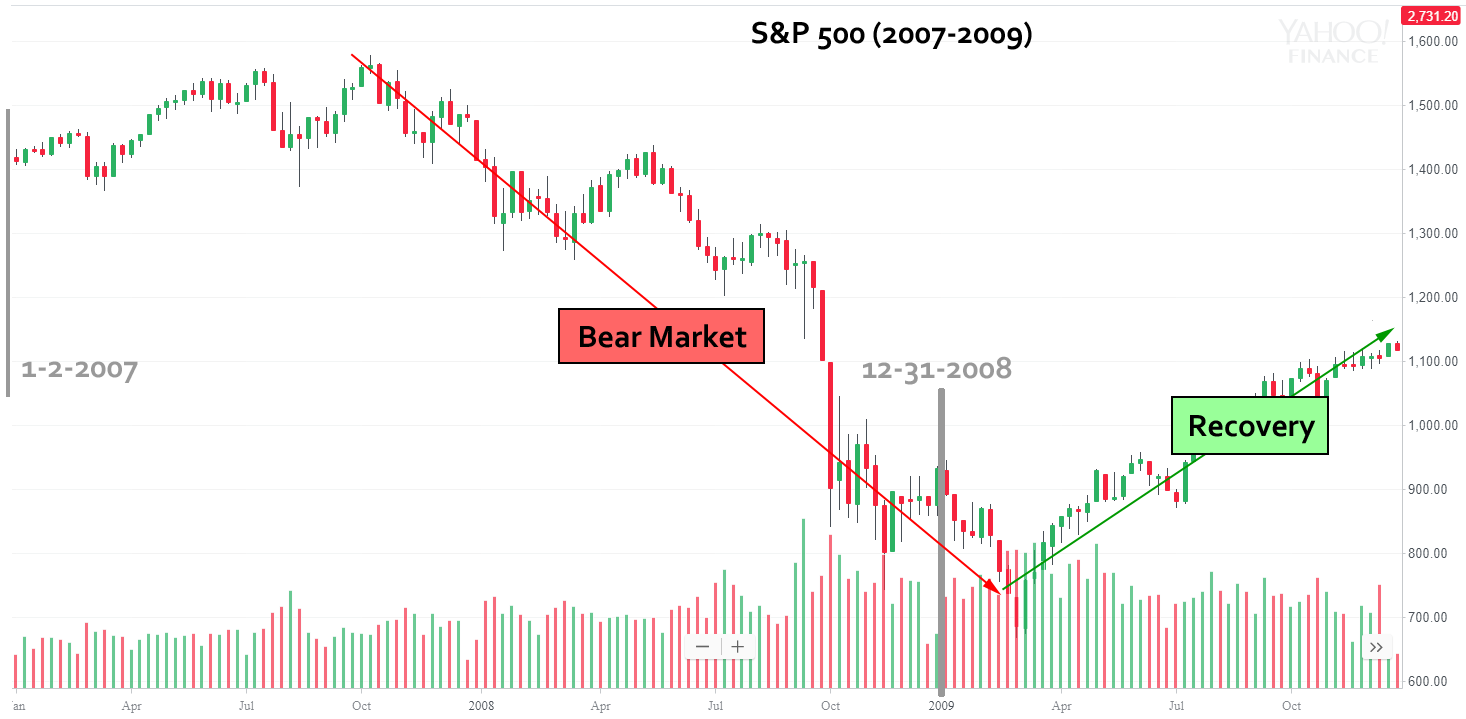
Since we are looking at total returns, it turns out those time periods show nearly identical results (2012-2018 was six-years and 2007-2009 was three-years). Yet more impressive, the strategy showed a 57% win rate by stock during the wildly volatile 2007-2009 market.
These results are empirical, which is to say, they are objective. We are not inserting opinion.
WHAT HAPPENED
We don't always have to look at directional option trades, and certainly don't always have to look at bullish trades. This is it -- this is how people profit from the option market -- finding trading opportunities that avoid earnings risk and work equally well during a bull or bear market that show risk exposure in short-bursts of time.
To see how to do this for any stock we welcome you to watch this quick demonstration video:
Tap Here to See the Tools at Work
Thanks for reading.
Risk Disclosure
You should read the Characteristics and Risks of Standardized Options.
Past performance is not an indication of future results.
Trading futures and options involves the risk of loss. Please consider carefully whether futures or options are appropriate to your financial situation. Only risk capital should be used when trading futures or options. Investors could lose more than their initial investment.
Past results are not necessarily indicative of future results. The risk of loss in trading can be substantial, carefully consider the inherent risks of such an investment in light of your financial condition.
Please note that the executions and other statistics in this article are hypothetical, and do not reflect the impact, if any, of certain market factors such as liquidity and slippage.
General Electric's Collapse Presents a Rare Opportunity
Short Bursts of Risk Exposure Have Created Rare Opportunity in General Electric Company
Date Published: 2018-03-9Author: Ophir Gottlieb
Disclaimer
The results here are provided for general informational purposes, as a convenience to the readers. The materials are not a substitute for obtaining professional advice from a qualified person, firm or corporation.
Preface
General Electric's epic stock collapse presents a rare opportunity.
While the market has been in full bull mode, General Electric Company (NYSE:GE) has not been. In fact, the stock is totally collapsing. Here is an one-year chart with GE in the candles and the Dow Jones in the blue line. GE is down fully 51% in the last year as the Dow has risen over 20%.
The goal with this type of stock move is to find trades that expose risk in short-bursts of time, with out-sized historical gains relative to historical losses but do not take stock direction risk.
The Trade Before Earnings in General Electric Company
We scanned the Dow 30 for the 4-days pre-earnings long straddle using Trade Machine Pro®.
And here's what we found, when we sorted by average return:
This is the best performing stock for this option strategy in the entire Dow Jones Industrial Average over the last year.
What's Going On
We examine the results of getting long a weekly at the money straddle 4-calendar days days before earnings, and then sell out of that position one-day before the actual release earnings.
Here is the setup:
We are testing opening the position 4 calendar days pre-earnings event and then closing the straddle 1 day before earnings. This is not making any earnings bet. This is not making any stock direction bet.
Once we apply that simple rule to our back-test, we run it on an at-the-money straddle:
Returns
If we did this long at-the-money (also called '50-delta') straddle (using the options closest to one-week in expiration) in General Electric Company (NYSE:GE) over the last three-years but only held it before earnings we get these results:
| GE Long At-the-Money Straddle |
|||
| % Wins: | 100.00% | ||
| Wins: 4 | Losses: 0 | ||
| % Return: | 129.6% | ||
In the latest year this pre-earnings option trade has 4 wins and lost 0 times and returned 129.6%.
Track this trade idea. Get alerted for ticker `GE` 4 days before earnings
The mechanics of the TradeMachine™ are that it uses end of day prices for every back-test entry and exit (every trigger).
Setting Expectations
While the total back-test return was 129%, we must look at the average return per trade.
➡ Over just the last year, the average percent return per trade was 31% over just 4-days each.
Tested Across Bull and Bear Markets
While many times we can identify strategies that work during a bull or a bear market, this strategy, when we tested it empirically, worked during both. Here are the specifics:
Using the Nasdaq 100 and the Dow 30 as our study group, here are the average total returns by stock for the bull market from 2012-2018 (January) and 2007-2009, which includes the bear market, and the wild 2009 -- where the S&P 500 bottomed in March and then ripped higher -- in other words, a highly volatile time in the market.
As a quick reminder, here is the 2007-2009 period for the S&P 500:
| Time Period | Return by Stock |
| 2012-2018 (January) | +40% |
| 2007-2009 | +21% |
Since we are looking at total returns, it turns out those time periods show nearly identical results (2012-2018 was six-years and 2007-2009 was three-years). Yet more impressive, the strategy showed a 57% win rate by stock during the wildly volatile 2007-2009 market.
These results are empirical, which is to say, they are objective. We are not inserting opinion.
WHAT HAPPENED
We don't always have to look at directional option trades, and certainly don't always have to look at bullish trades. This is it -- this is how people profit from the option market -- finding trading opportunities that avoid earnings risk and work equally well during a bull or bear market that show risk exposure in short-bursts of time.
To see how to do this for any stock we welcome you to watch this quick demonstration video:
Tap Here to See the Tools at Work
Thanks for reading.
Risk Disclosure
You should read the Characteristics and Risks of Standardized Options.
Past performance is not an indication of future results.
Trading futures and options involves the risk of loss. Please consider carefully whether futures or options are appropriate to your financial situation. Only risk capital should be used when trading futures or options. Investors could lose more than their initial investment.
Past results are not necessarily indicative of future results. The risk of loss in trading can be substantial, carefully consider the inherent risks of such an investment in light of your financial condition.
Please note that the executions and other statistics in this article are hypothetical, and do not reflect the impact, if any, of certain market factors such as liquidity and slippage.