Alphabet Inc - Ordinary Shares - Class A
XNAS:GOOG 4:00:00 PM EDT
317.69
-24.40
(-7.13%)
6:56:28 PM EDT: $319.56 +1.87 (+0.59%)


Chart Storm: November 17th, 2015
Stocks in focus: Google, Disney, Celgene, Amgen, Avago
Written by Ophir Gottlieb
Stocks in focus: Google, Disney, Celgene, Amgen, Avago
Written by Ophir Gottlieb
This is just one of several weekly reports CML Pro subscribers receive: Five charts that will blow your mind and give you knowledge.
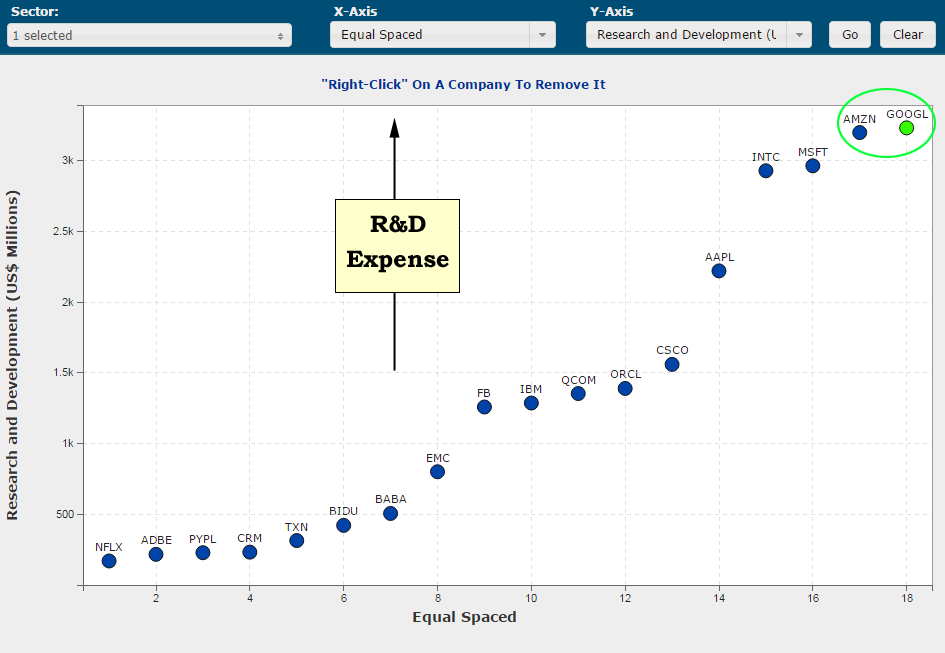
Chart #1: Google's R&D is the Largest in the World
The full Google story is available in CML Pro but for now we must note that the company is spending more in research and development than any company in the world. The y-axis plots R&D and the x-axis equal spaces (ranks) the companies.
➢ Chart in Pro is Here
We write one story a day to uncover new opportunities and break news. Come on in: Get Our (Free) News Alerts Once a Day.
This is a story that not too long ago was dominated by Intel, but oh how the times have changed. Google, like Apple, is looking to disrupt technology not just for now, but for the next several decades. It's impossible not to make note of the fact that Amazon (AMZN) is number two, ahead of Microsoft and Intel. We also note, though not charted in this image, that Apple has increased its R&D expenditures by 90% in the last two-years. yes, the largest company in the world has nearly duobled its R&D.
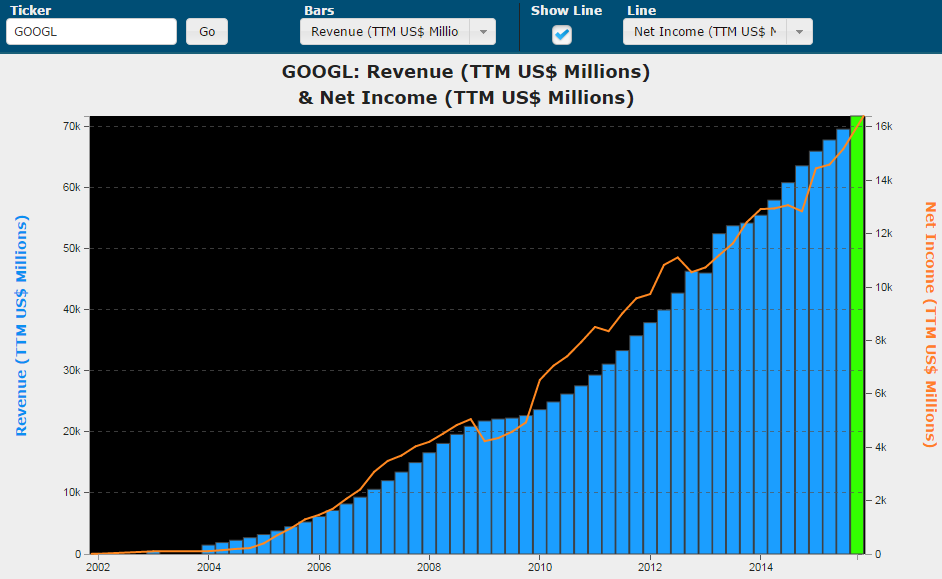
Chart #2: Google Revenue and Earnings are at All-time Highs
We plot revenue over trailing-twelve-month (TTM) periods in the blue bars and net income (TTM) in the orange line. We note that the green bar represents an all-time high.
➢ Chart in Pro is Here
The main stream media doesn't have the vocabulary to understand breaking technology. Get free news alerts (once a day) from us and you will be the expert in the room. Get Our (Free) News Alerts.
We can see exactly why Google stock is ripping to all time highs, up nearly 40% in the last year and the company has a valuation near half a trillion dollars. It's this simple: revenue and earnings are crushing it.
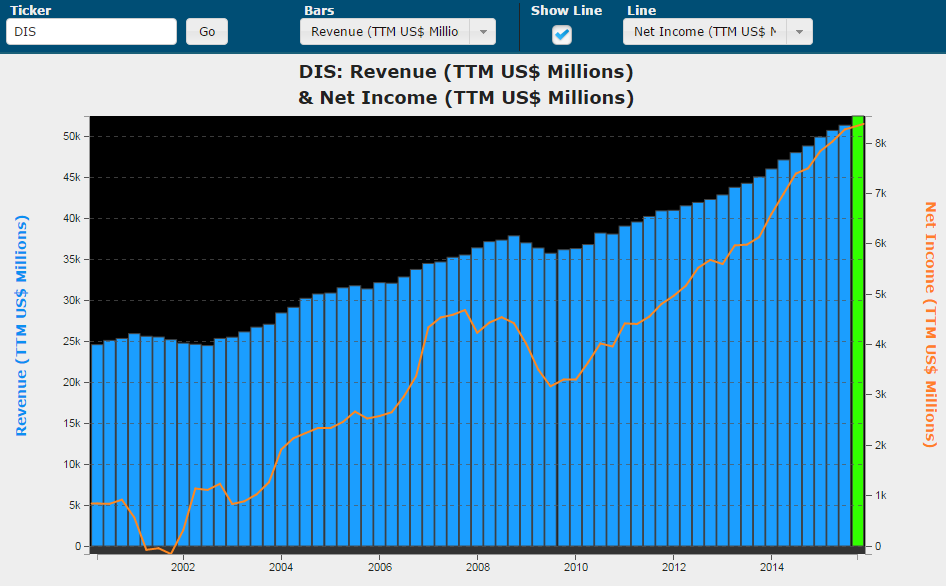
Chart #3: Disney is Crushing it
Just like the chart above, we have plotted revenue (TTM) in the blue bars and net income (TTM) in the orange line. Disney has broken all-time highs in both metrics and it has pushed the stock up nearly 30% in the last year.
➢ Chart in Pro is Here
Wall Street simply doesn't have the knowledge or interest to share truly groundbreaking research. It just doesn't. Get free news alerts (once a day) from us.
What once was a "boring" blue chip has now turned into a flexible, adapting, innovative, and content collecting machine. The bullish argument for Disney is that CEO Bob Iger, by collecting the Star Wars, Pixar and Marvel content into the Disney juggernaut has created a large pool of profits for several years to come. Further, the company has recently been saying that ESPN may bypass cable for streaming eventually. But there's so much more going on with Disney.
The full Disney story is here: Disney's Huge Growth Opportunity.
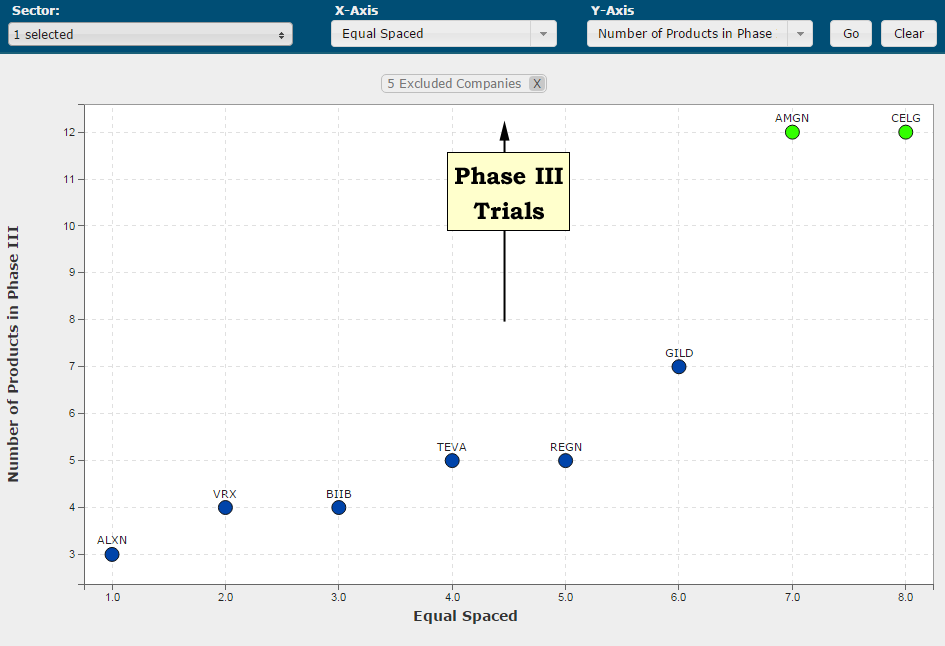
Chart #4: Biotech Pipelines
If we take every mega cap biotech and plot the number of Phase III trials on the y-axis and equal space (rank) the x-axis, we can see which companies have massive pipeline opportunities that will be judged very soon.
➢ Chart in Pro is Here
Celegene and Amgen both have an incredible 12 Phase III trials, which ties them for the top spot. The individual and detailed stories about both companies are available here.
A Phase III trial occures when the drug or treatment is given to large groups of people to confirm its effectiveness, monitor side effects, compare it to commonly used treatments, and collect information that will allow the drug or treatment to be used safely. After these trials companies move to the formal step called New Drug Application (NDA). In this step a drug sponsor takes the results to ask that the FDA to consider approving a new drug for marketing in the United States.
Do you enjoy using visualizations to understand what's really going on in a company? We do too. Get Our (Free) News Alerts Once a Day.
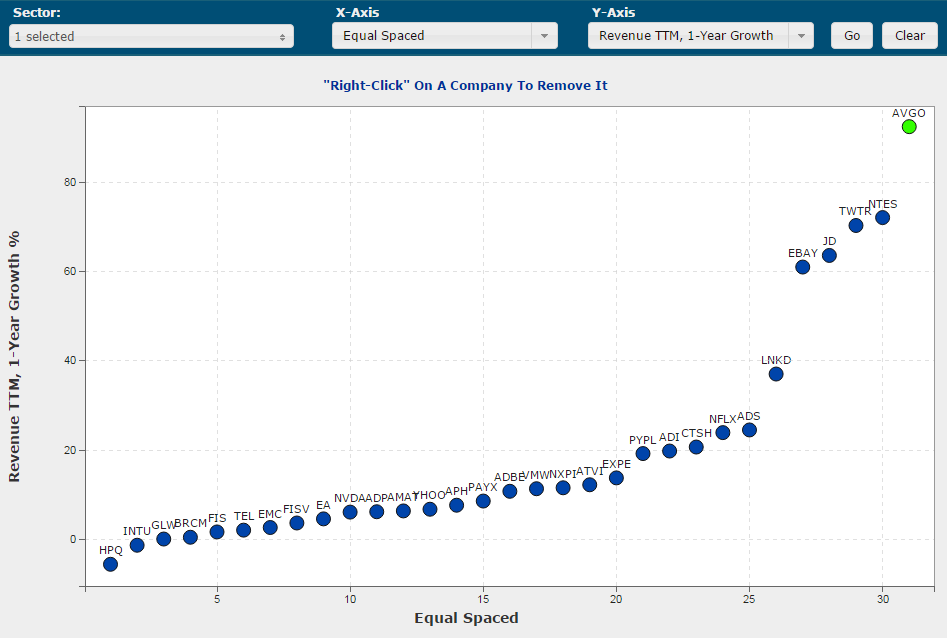
Chart #5: Technology's Greatest Growth Companies
If we take all of the tech companies between $15 billion and $50 billion in market cap and plot revenue growth on the y-axis and equal space (rank) the companies on the x-axis, we see the companies realzing the greatest growth.
➢ Chart in Pro is Here
Do you thrive on knowledge and going beyond the headlines? Get Our (Free) News Alerts Once a Day.
Avago ranks number one here and has for a while. Some of the growth is through acquisition but the company is a radically innovative and acquisitive technology company. It's soon to be so well diversified and so comprehensive in its offerings, that it may be the single most important company in technology not named Apple, Google, Amazon or Facebook. The full story, Avago is the New Giant Dominating Technology, is available in Pro.
We also note that, even with all the user growth issues, Twitter is still growing revenue faster than all but three of its peers and we also note that Netflix, even with its absurd growth, is still ranked eighth on this chart.
This is just one of the fantastic reports that CML Pro subscribers get several times a week. Get CML Pro and Be the Expert.
Thanks for reading.
Get Our (Free) News Alerts Once a Day. Be Powerful.
Chart #1: Google's R&D is the Largest in the World
The full Google story is available in CML Pro but for now we must note that the company is spending more in research and development than any company in the world. The y-axis plots R&D and the x-axis equal spaces (ranks) the companies.
➢ Chart in Pro is Here
We write one story a day to uncover new opportunities and break news. Come on in: Get Our (Free) News Alerts Once a Day.
This is a story that not too long ago was dominated by Intel, but oh how the times have changed. Google, like Apple, is looking to disrupt technology not just for now, but for the next several decades. It's impossible not to make note of the fact that Amazon (AMZN) is number two, ahead of Microsoft and Intel. We also note, though not charted in this image, that Apple has increased its R&D expenditures by 90% in the last two-years. yes, the largest company in the world has nearly duobled its R&D.
Chart #2: Google Revenue and Earnings are at All-time Highs
We plot revenue over trailing-twelve-month (TTM) periods in the blue bars and net income (TTM) in the orange line. We note that the green bar represents an all-time high.
➢ Chart in Pro is Here
The main stream media doesn't have the vocabulary to understand breaking technology. Get free news alerts (once a day) from us and you will be the expert in the room. Get Our (Free) News Alerts.
We can see exactly why Google stock is ripping to all time highs, up nearly 40% in the last year and the company has a valuation near half a trillion dollars. It's this simple: revenue and earnings are crushing it.
Chart #3: Disney is Crushing it
Just like the chart above, we have plotted revenue (TTM) in the blue bars and net income (TTM) in the orange line. Disney has broken all-time highs in both metrics and it has pushed the stock up nearly 30% in the last year.
➢ Chart in Pro is Here
Wall Street simply doesn't have the knowledge or interest to share truly groundbreaking research. It just doesn't. Get free news alerts (once a day) from us.
What once was a "boring" blue chip has now turned into a flexible, adapting, innovative, and content collecting machine. The bullish argument for Disney is that CEO Bob Iger, by collecting the Star Wars, Pixar and Marvel content into the Disney juggernaut has created a large pool of profits for several years to come. Further, the company has recently been saying that ESPN may bypass cable for streaming eventually. But there's so much more going on with Disney.
The full Disney story is here: Disney's Huge Growth Opportunity.
Chart #4: Biotech Pipelines
If we take every mega cap biotech and plot the number of Phase III trials on the y-axis and equal space (rank) the x-axis, we can see which companies have massive pipeline opportunities that will be judged very soon.
➢ Chart in Pro is Here
Celegene and Amgen both have an incredible 12 Phase III trials, which ties them for the top spot. The individual and detailed stories about both companies are available here.
A Phase III trial occures when the drug or treatment is given to large groups of people to confirm its effectiveness, monitor side effects, compare it to commonly used treatments, and collect information that will allow the drug or treatment to be used safely. After these trials companies move to the formal step called New Drug Application (NDA). In this step a drug sponsor takes the results to ask that the FDA to consider approving a new drug for marketing in the United States.
Do you enjoy using visualizations to understand what's really going on in a company? We do too. Get Our (Free) News Alerts Once a Day.
Chart #5: Technology's Greatest Growth Companies
If we take all of the tech companies between $15 billion and $50 billion in market cap and plot revenue growth on the y-axis and equal space (rank) the companies on the x-axis, we see the companies realzing the greatest growth.
➢ Chart in Pro is Here
Do you thrive on knowledge and going beyond the headlines? Get Our (Free) News Alerts Once a Day.
Avago ranks number one here and has for a while. Some of the growth is through acquisition but the company is a radically innovative and acquisitive technology company. It's soon to be so well diversified and so comprehensive in its offerings, that it may be the single most important company in technology not named Apple, Google, Amazon or Facebook. The full story, Avago is the New Giant Dominating Technology, is available in Pro.
We also note that, even with all the user growth issues, Twitter is still growing revenue faster than all but three of its peers and we also note that Netflix, even with its absurd growth, is still ranked eighth on this chart.
This is just one of the fantastic reports that CML Pro subscribers get several times a week. Get CML Pro and Be the Expert.
Thanks for reading.
Get Our (Free) News Alerts Once a Day. Be Powerful.