The Wonderful Secret Behind Options Earnings Trading in Alphabet Inc (NASDAQ:GOOGL)

Date Published: 2017-04-27
Written by Ophir Gottlieb
LEDE
There is a way to trade options right before earnings announcements in Google, and all stocks, that benefits from the rising implied volatility but avoids the risk into the actual earnings release. This approach has returned nearly 90% in Alphabet Inc (NASDAQ:GOOGL) options with a total holding period of just 55-days.
Preface
Everyone knows that the day of an earnings announcement is a risky event for a stock. This can be explicitly seen in the option market, where the implied volatility (the expected stock move) rises into the earnings event.
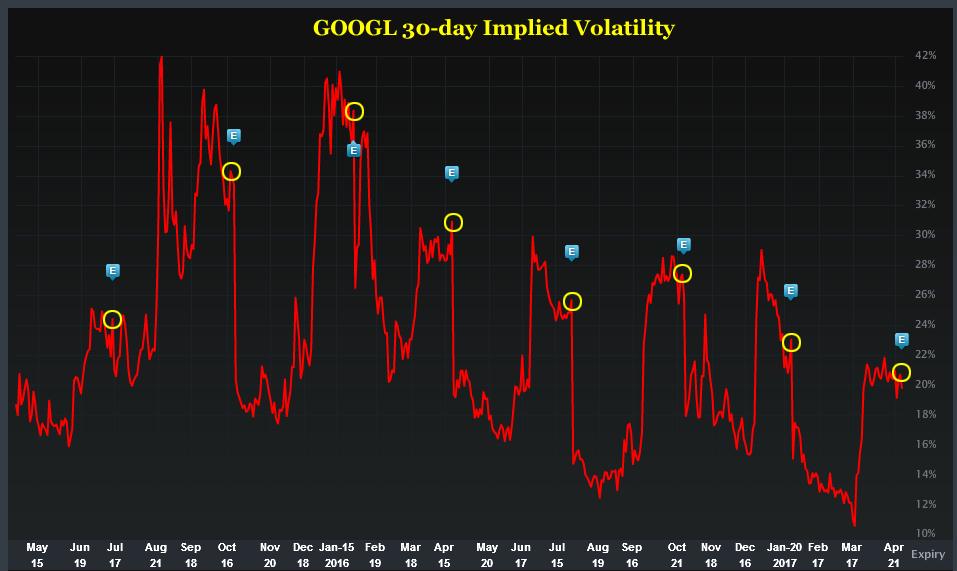
Here is a great illustration of that reality using Alphabet Inc and a chart of its 30-day implied volatility over the last two-years. While the implied volatility ebbs and flows, it always rises into earnings, which are denoted in the chart below with the "E" icon. We circled the rise in yellow for convenience.
The question every option trader, whether professional or amateur, has long asked is if there is a way to profit from this known volatility rise. It turns out, that over the long-run, for stocks with certain tendencies, the answer is actually, yes.
Yes, there is a systematic way to trade this repeating phenomenon, without making a bet on earnings or stock direction.
THE WONDERFUL SECRET
What a trader wants to do is to see the results of buying an at the money straddle a few days before earnings, and then sell that straddle just before earnings. The goal, at first, appears to be to benefit from that known implied volatility rise, but as we will see soon, there is actually much more to gain from this trade.
This trade is not a panacea, which is to say, we have to test it, stock by stock, to see when and why it worked. We start with Alphabet Inc (NASDAQ:GOOGL). Here is the setup:
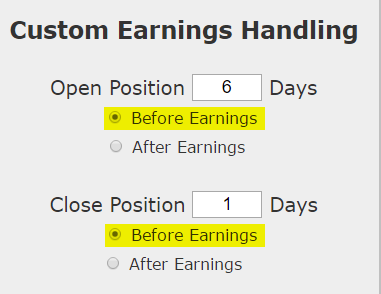
We are testing opening the position 6 days before earnings and then closing the position 1 day before earnings. We are not making any earnings bet. Once we apply that simple rule to our back-test, we run it on an at-the-money straddle:
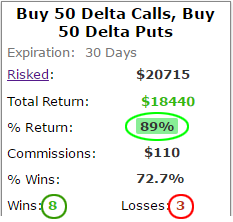
We see a 89% return, testing this over the last 11 earnings dates in Google. That's a total of just 55 trading days (5 days for each earnings date, over 11 earnings dates). We can also see that this strategy hasn't been a winner all the time, rather it has won 8 times and lost 3 times, for a 72.7% win-rate and again, that staggering 89% return in less than two-full months of trading.
This approach as also been a large winner over the last two-years:
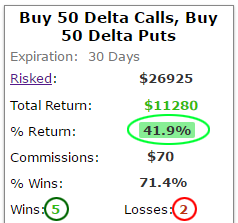
We see a 41.9% return over seven earnings releases, with 5 winning trades and 2 losing trades, or a 71.4% win-rate.
BUT WHAT'S REALLY HAPPENING?
While this strategy is benefiting from the implied volatility rise into earnings, what it's really doing is far more intelligent. The option prices for the at-the-money straddle will show very little time decay over this 5-day period, so what this strategy really does is buy "five free days" of potential stock movement. If that sounded weird, here it is in black and white:
The first trade in this 2-year back-test was to purchase the 557.5 strike straddle in Google on July 10th, 2015 in anticipation of the earnings that came out on July 16th. The opening straddle was purchased for $29.20.
But, between July 10th and July 15th (the date the straddle was closed), here's what Google stock did:
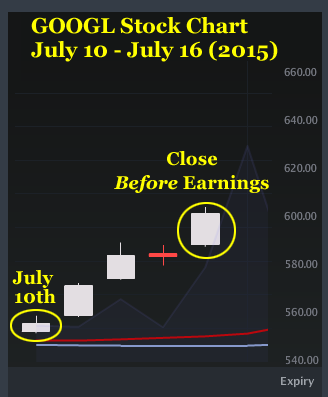
While no news was released during this time with respect to earnings, the stock climbed in anticipation of the event. That rise made owning the straddle a winner -- it was sold at $35.40 which was a 21% winner in five days.
Of course, if the stock had declined, that would have been an equally big winner. But the real moment of clarity is to understand that if the stock did nothing, the straddle was about breakeven.
So, what we're really seeing here is that owning this earnings straddle just a few days before the event, and selling it right before the event, gets us a window of a sort of "very cheap bet," where the upside is enormous, and the downside is quite limited.
As an example of the limited risk, we can turn to the earnings event the next year, on July 28th, 2016. Here's what Google's price did:
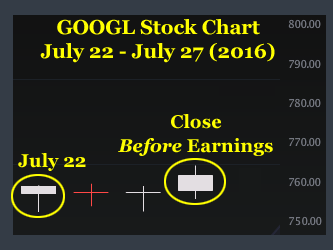
The stock basically went nowhere and so did the straddle. It was opened for $41.70 and was closed for $41.75.
The trade was a wash, but, it gave us those few days to potentially have a stock move with muted risk. Over time, having this "low risk five-day option," turned into a monster winner. There were some small losers, some small winners, some large winners, but there were no large losers.
WHAT HAPPENED
This is it -- this is how people profit from the option market -- it's preparation, not luck.
To see how to do this for any stock and for any strategy, with just the click of a few buttons, we welcome you to watch this 4-minute demonstration video:
Tap Here to See the Tools at Work
Thanks for reading.
Risk Disclosure
You should read the Characteristics and Risks of Standardized Options.
Past performance is not an indication of future results.
Trading futures and options involves the risk of loss. Please consider carefully whether futures or options are appropriate to your financial situation. Only risk capital should be used when trading futures or options. Investors could lose more than their initial investment.
Past results are not necessarily indicative of future results. The risk of loss in trading can be substantial, carefully consider the inherent risks of such an investment in light of your financial condition.
The author has no position in Alphabet Inc (NASDAQ:GOOGL) stock as of this writing.


