Timing Alphabet Inc Options Around Earnings

Date Published: 2017-07-25
Written by Ophir Gottlieb
LEDE
Alphabet Inc (NASDAQ:GOOGL) followed its pre-earnings pattern beautifully that we discussed in a prior dossier, where the stock tends to rally into earnings and owning a call for just the two-weeks ahead of earnings was a winner and it's now time to look at the after-earnings trade pattern. For the pre-earnings trade, this time around, that earnings momentum play returned 117%.
| GOOGL: Long 40 delta Call | |||
| % Wins: | 100% | ||
| Wins: 1 | Losses: 0 | ||
| % Return: | 117% | ||
And this is how that trade looked for the prior two-years:
But now it's time to investigate Alphabet's post-earnings patterns, and we do that with a short put spread.
The Trade After Earnings
Selling a put spread every month in a stock that is rising, in hindsight, obviously looks like a great idea. But, there is a lot of risk in that trade, namely, the risk of an abrupt stock drop and a market sell-off that takes all stocks with it. So, we want to reduce the risk while not affecting the returns.
One of our go to trade set-ups starts by asking the question if trading every month is worth it -- is it profitable -- is it worth the risk? There's an action plan that measures this exactly, and the results are powerful for Alphabet Inc.
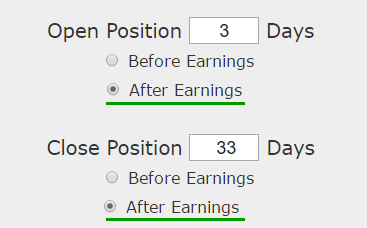
Let's test the idea of selling a put spread only in the month after earnings. Here's what we mean:

Our idea here is that after earnings are reported, and after the stock does all of its gymnastics, up or down, that three-days following the earnings move and for the next month, the stock is then in a quiet period.
If it gapped down -- that gap is over. If it beat earnings, the downside move is already likely muted. Here is the set-up:

More explicitly, the rules are:
Rules
* Open short put spread 3 calendar days after earnings.
* Close short put spread 30 calendar days later.
* Use the option that is closest to but greater than 30-days away from expiration.
And here are the results of implementing this much finer strategy over the last three-years:
| GOOGL: Short 25/15 Delta Put Spread | |||
| % Wins: | 91.7% | ||
| Wins: 11 | Losses: 1 | ||
| % Return: | 218% | ||
Tap Here to See the Actual Back-test
We see a 218% winner that only traded the month following earnings and took no risk at all other times. The trade has won 11 out of the 12 last earnings cycles times, or a 91.7% win-rate.
Here is how the strategy has done over the last year:
| GOOGL: Short 25/15 Delta Put Spread | |||
| % Wins: | 100% | ||
| Wins: 4 | Losses: 0 | ||
| % Return: | 51.1% | ||
Tap Here to See the Actual Back-test
Now we a 51.1% return on just four full months of trading.
The results are incredibly consistent, so much so that we need to take a step back and still examine the potential pitfalls here.
NO GUARANTEES
There are no guarantees to this trade, but it does appear to a very high probability investment, but even as such, it does have some drawbacks. If we look at the last three-months ago , we actually tested this trade (May 2017):

That is, selling a 910/892.5 put spread @ $2.63. This trade, as constructed, had a maximum win amount of $2.63 (the credit received), but it had a maximum loss of $14.87, which is the difference in the strikes (910 - 892.5) minus the credit received ($2.63). That means the max gain: max loss ratio was 1:5.6.
And yes, the trade worked out well, closing that February for $0.03. But, we do, at the very least, need to be aware of the trade we are examining.
MANAGING EXPECTATIONS
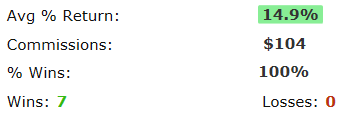
We recently added the average win percent per trade to the trade details section of the Trade Machine, and this is what we see with this trade over the last 2-years:

In English, the average trade returned 14.9%. It was the accumulation of these short-term 15% wins that has created a total back-test with a massive return.
We also note that when GOOGL has these bad reactions off of earnings, it has worked best to wait the full three-days for the stock to calm down before entering this post-earnings set-up.
WHAT HAPPENED
This is it. This is just one of the ways people profit from the option market. To see how to do this for any stock and for any strategy, including covered calls, with just the click of a few buttons, we welcome you to watch this quick demonstration video:
Tap Here to See the Tools at Work
Thanks for reading.
Risk Disclosure
You should read the Characteristics and Risks of Standardized Options.
Past performance is not an indication of future results.
Trading futures and options involves the risk of loss. Please consider carefully whether futures or options are appropriate to your financial situation. Only risk capital should be used when trading futures or options. Investors could lose more than their initial investment.
Past results are not necessarily indicative of future results. The risk of loss in trading can be substantial, carefully consider the inherent risks of such an investment in light of your financial condition.
The author has no position Alphabet Inc as of this writing.
Back-test Link


