Alphabet Inc, GOOGL, earnings, option, optimism

Preface
We examine many patterns with the CML Trade Machine™ and one of our most followed is the pre-earnings momentum that many of the high momentum tech stocks experience. We noted it on 25-July-2017 ahead of GOOGL earnings period and saw the calls rise 104% in the two-weeks before earnings.
According to our data provider, Wall Street Horizon, Alphabet Inc has earnings due out on 10-26-1017, and that means 14-days before then would be 10-12-2017. Let's look at this pattern again.
PREMISE
The premise is simple -- one of the least recognized but most important phenomena surrounding this bull market is the amount of optimism, or upward momentum, that sets in the two-weeks before an earnings announcement. Now we can see it in Alphabet Inc.
The Options Optimism Trade Before Earnings in Alphabet Inc
Let's look at the results of buying a monthly call option in Alphabet Inc 14-days before earnings (using calendar days) and selling the call before the earnings announcement.
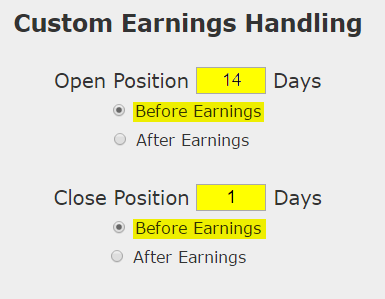
Here's the set-up in great clarity; again, note that the trade closes before earnings, so this trade does not make a bet on the earnings result.

Now, unlike many of our other set-ups, this is in fact a straight down the middle bullish bet -- this absolutely takes on directional stock risk, so let's be conscious of that before we see the results, because they are mind bending.
RISK MANAGEMENT
We can add another layer of risk management to the back-test by instituting and 40% stop loss and a 40% limit gain. Here is that setting:

In English, at the close of each trading day we check to see if the long option is either up or down 40% relative to the open price. If it was, the trade was closed.
DISCOVERY
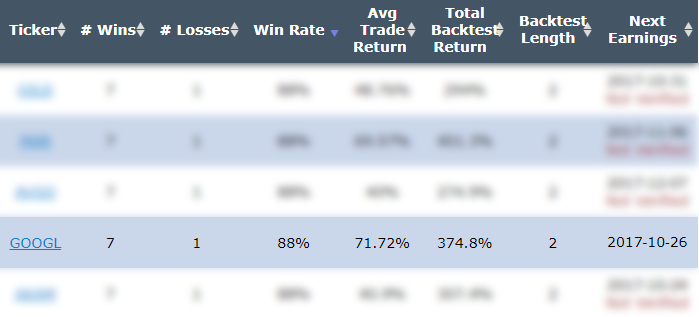
As always, we rely on the Trade Machine™ Pro scanner for our back-test discovery. We looked at the NASDAQ 100, 14-day pre-earnings long call and at 2-year results.

Since that scan doesn't actually use a stop/limit, it shows GOOGL with 7 wins and 1 loss. We added the stop and limit to optimize the back-test.

We note that in the entire Nasdaq 100, GOOGL is one of just five stocks with a win rate this high for this strategy.
RESULTS
Here are the results over the last two-years in Alphabet Inc:
Tap Here to See the Back-test
The mechanics of the TradeMachine are that it uses end of day prices for every back-test entry and exit (every trigger).
We see a 356% return, testing this over the last 8 earnings dates in Alphabet Inc. That's a total of just 104 days (13 days for each earnings date, over 8 earnings dates). That has been the power of following the trend of optimism into earnings -- and never even worrying about the actual earnings result.
Setting Expectations
While this strategy had an overall return of 356%, the trade details keep us in bounds with expectations:
➡ The average percent return per trade was 50.4% over each 13-day period.
Checking More Time Periods in Alphabet Inc
Now we can look at just the last year as well:
We're now looking at 200% returns, on 4 winning trades and 0 losing trades.
➡ The average percent return over the last year per trade was 51.2% over the 13-day period, which is quite similar to the 2-year average result.
CONTEXT
While CML Pro members will have a thorough dossier on Google's latest annual meeting, suffice it to say Wall Street was wowed by their new hardware, or really, the integration of their incredible new artificial intelligence applications, like the instantaneous translation of 40 languages in real time in your ear buds.
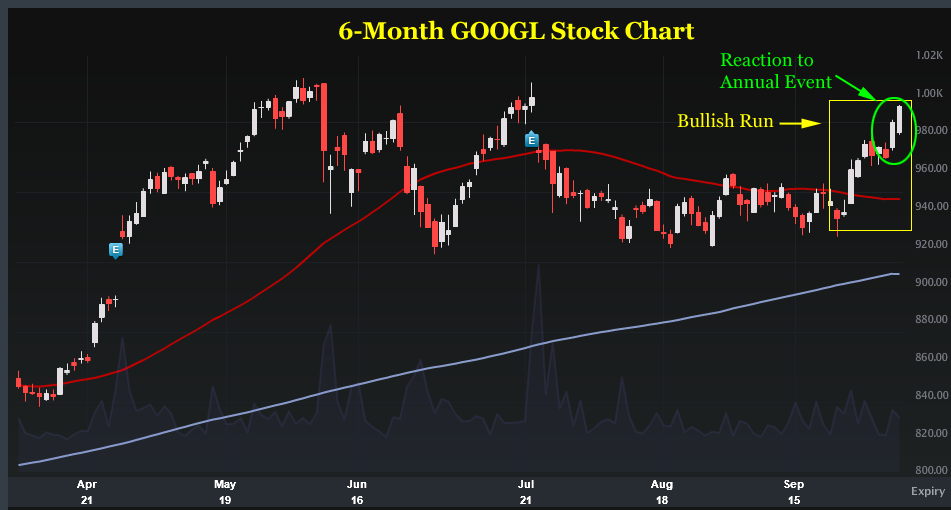
Here is a six-month chart for Alphabet stock, and we have highlighted the recent stock run:

Let's see if that bullish narrative builds and if we don't get some analyst upgrades in the near future to make this bullish momentum play continue. Of course, we must note, in a toppy market, if there is any kind of extraneous risk (like political) or if the market just sells off into this upcoming earnings season on total, then a bullish bet is likely not going to work well, irrespective of the past patterns.
WHAT HAPPENED
Bull markets tend to create optimism, whether it's deserved or not. To see how to test this for any stock we welcome you to watch this quick demonstration video:
Tap Here to See the Tools at Work
Risk Disclosure
You should read the Characteristics and Risks of Standardized Options.
Past performance is not an indication of future results.
Trading futures and options involves the risk of loss. Please consider carefully whether futures or options are appropriate to your financial situation. Only risk capital should be used when trading futures or options. Investors could lose more than their initial investment.
Past results are not necessarily indicative of future results. The risk of loss in trading can be substantial, carefully consider the inherent risks of such an investment in light of your financial condition.
Please note that the executions and other statistics in this article are hypothetical, and do not reflect the impact, if any, of certain market factors such as liquidity and slippage.
Trading Momentum into Alphabet Earnings

Alphabet Inc (NASDAQ:GOOGL) : Trading Momentum into Earnings Optimism With Options
Date Published: 2017-10-8Author: Ophir Gottieb
Preface
We examine many patterns with the CML Trade Machine™ and one of our most followed is the pre-earnings momentum that many of the high momentum tech stocks experience. We noted it on 25-July-2017 ahead of GOOGL earnings period and saw the calls rise 104% in the two-weeks before earnings.
According to our data provider, Wall Street Horizon, Alphabet Inc has earnings due out on 10-26-1017, and that means 14-days before then would be 10-12-2017. Let's look at this pattern again.
PREMISE
The premise is simple -- one of the least recognized but most important phenomena surrounding this bull market is the amount of optimism, or upward momentum, that sets in the two-weeks before an earnings announcement. Now we can see it in Alphabet Inc.
The Options Optimism Trade Before Earnings in Alphabet Inc
Let's look at the results of buying a monthly call option in Alphabet Inc 14-days before earnings (using calendar days) and selling the call before the earnings announcement.
Here's the set-up in great clarity; again, note that the trade closes before earnings, so this trade does not make a bet on the earnings result.

Now, unlike many of our other set-ups, this is in fact a straight down the middle bullish bet -- this absolutely takes on directional stock risk, so let's be conscious of that before we see the results, because they are mind bending.
RISK MANAGEMENT
We can add another layer of risk management to the back-test by instituting and 40% stop loss and a 40% limit gain. Here is that setting:

In English, at the close of each trading day we check to see if the long option is either up or down 40% relative to the open price. If it was, the trade was closed.
DISCOVERY
As always, we rely on the Trade Machine™ Pro scanner for our back-test discovery. We looked at the NASDAQ 100, 14-day pre-earnings long call and at 2-year results.

Since that scan doesn't actually use a stop/limit, it shows GOOGL with 7 wins and 1 loss. We added the stop and limit to optimize the back-test.

We note that in the entire Nasdaq 100, GOOGL is one of just five stocks with a win rate this high for this strategy.
RESULTS
Here are the results over the last two-years in Alphabet Inc:
| GOOGL: Long 40 Delta Call | |||
| % Wins: | 100% | ||
| Wins: 8 | Losses: 0 | ||
| % Return: | 356% | ||
Tap Here to See the Back-test
The mechanics of the TradeMachine are that it uses end of day prices for every back-test entry and exit (every trigger).
We see a 356% return, testing this over the last 8 earnings dates in Alphabet Inc. That's a total of just 104 days (13 days for each earnings date, over 8 earnings dates). That has been the power of following the trend of optimism into earnings -- and never even worrying about the actual earnings result.
Setting Expectations
While this strategy had an overall return of 356%, the trade details keep us in bounds with expectations:
➡ The average percent return per trade was 50.4% over each 13-day period.
Checking More Time Periods in Alphabet Inc
Now we can look at just the last year as well:
We're now looking at 200% returns, on 4 winning trades and 0 losing trades.
➡ The average percent return over the last year per trade was 51.2% over the 13-day period, which is quite similar to the 2-year average result.
CONTEXT
While CML Pro members will have a thorough dossier on Google's latest annual meeting, suffice it to say Wall Street was wowed by their new hardware, or really, the integration of their incredible new artificial intelligence applications, like the instantaneous translation of 40 languages in real time in your ear buds.
Here is a six-month chart for Alphabet stock, and we have highlighted the recent stock run:

Let's see if that bullish narrative builds and if we don't get some analyst upgrades in the near future to make this bullish momentum play continue. Of course, we must note, in a toppy market, if there is any kind of extraneous risk (like political) or if the market just sells off into this upcoming earnings season on total, then a bullish bet is likely not going to work well, irrespective of the past patterns.
WHAT HAPPENED
Bull markets tend to create optimism, whether it's deserved or not. To see how to test this for any stock we welcome you to watch this quick demonstration video:
Tap Here to See the Tools at Work
Risk Disclosure
You should read the Characteristics and Risks of Standardized Options.
Past performance is not an indication of future results.
Trading futures and options involves the risk of loss. Please consider carefully whether futures or options are appropriate to your financial situation. Only risk capital should be used when trading futures or options. Investors could lose more than their initial investment.
Past results are not necessarily indicative of future results. The risk of loss in trading can be substantial, carefully consider the inherent risks of such an investment in light of your financial condition.
Please note that the executions and other statistics in this article are hypothetical, and do not reflect the impact, if any, of certain market factors such as liquidity and slippage.


