Symbol not found
:HES 00:00AM GMT
0.00
0.00
(0.00%)


Hess Corporation, HES, 40, 10, earnings, options, volatility, Optimizing

Disclaimer
The results here are provided for general informational purposes, as a convenience to the readers. The materials are not a substitute for obtaining professional advice from a qualified person, firm or corporation.
LEDE
This is a slightly advanced option trade that bets on volatility for a period that starts the day of Hess Corporation (NYSE:HES) earnings, which are reported before the market opens and lasts for the 10 calendar days to follow, that has been a winner for the last 3 years. We note the use of strict risk controls in this analysis and strict attention to earnings timing.
Hess Corporation (NYSE:HES) Earnings
The post-earnings moves in HES have been on our radar for a while, and we watched this time around to see yet another big move, so now we are publishing the pattern for Trade Machine Pro Members. This one requires detailed attention.
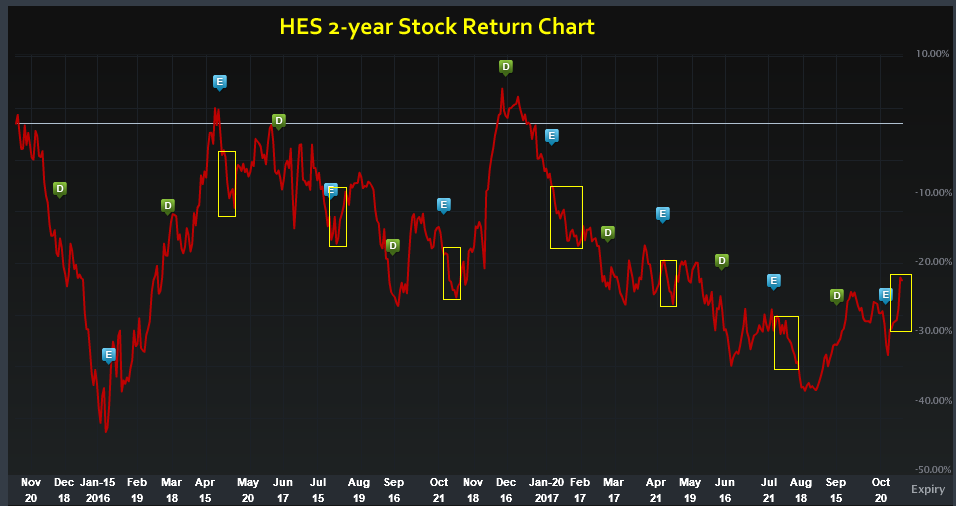
Here is a two-year stock return chart, where the blue "E" icons represent the earnings event. You can see how the stock does tend to move quite a bit for the 5-10 days after the announcement.
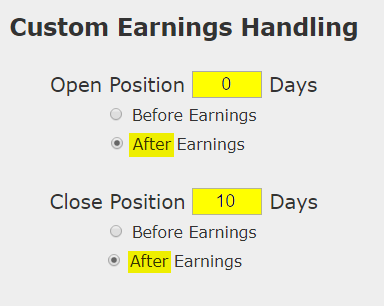
Simply owning options after earnings, blindly, is likely not a good trade, but hand-picking the times and the stocks to do it in can be useful. We can test this approach without bias with a custom option back-test. Here is the timing set-up around earnings:
Rules
* Open the long 40 delta strangle on the day of earnings, but at the close, after earnings are announced that morning.
* Close the strangle 10 calendar days after earnings -- don't let the option expire worthless.
* Use the options closest to 14 days from expiration (but at least 10-days).
This is a straight down the middle volatility bet -- this trade wins if the stock is volatile the week following earnings and it will stand to lose if the stock is not volatile. This is not a silver bullet -- it's a trade that needs to be carefully examined.
But, this is a stock direction neutral strategy, which is to say, it wins if the stock moves up or down -- it just has to move.
RISK CONTROL
Since blindly owning volatility can be a quick way to lose in the option market, we will apply a tight risk control to this analysis as well. We will add a 40% stop loss and a 40% limit gain.
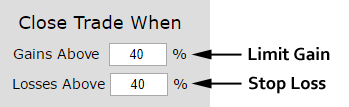
In English, at the close of every trading day, if the strangle is up 40% from the price at the start of the trade, it gets sold for a profit. If it is down 40%, it gets sold for a loss.
DETAILS
For this back-test, the details matter. Two-things to note:
* The opening trade is made on the day of earnings, which are reported in the morning, but at the close, so the stock does have a full day to react first.
* The options are those that are closest to 14-days to expiration, so the closing trigger, if it's not a stop or a limit, is still well before expiration of those options -- it does not wait until those options decay to zero.
DISCOVERY
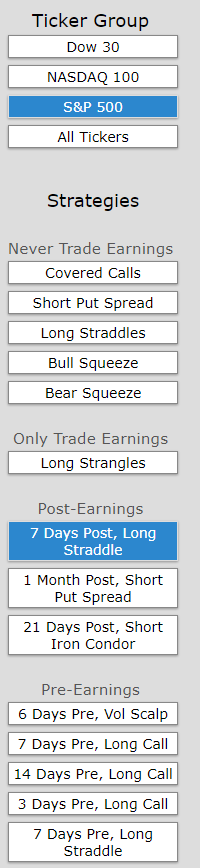
We started down the path of trade discovery by looking at the S&P 500, and the 7-day post-earnings straddles. We sorted by the most wins in the last 3-years, which led us to HES, and then we did our optimization (making it 10-days rather than 7, looking at two-week options rather one-week, and using a strangle rather than a straddle), by hand.
And here are the results:
RESULTS
If we bought the 40 delta strangle (bought the 40 delta call and bought the 40-delta put) in Hess Corporation (NYSE:HES) over the last three-years but only held it after earnings we get these results:
The mechanics of the TradeMachine™ are that it uses end of day prices for every back-test entry and exit (every trigger).
We see a 441% return, testing this over the last 12 earnings dates in Hess Corporation. That's a total of just 120 days (10 days for each earnings date, over 12 earnings dates).
Looking at Averages
The overall return was 441%; but the trade statistics tell us more with average trade results:
➡ The average return per trade was 43.8% over 10-days.
➡ The average return per winning trade was 51.9% over 10-days.
➡ The return for the losing trade was -45.9% over those 10-days.
Looking at the Last Year
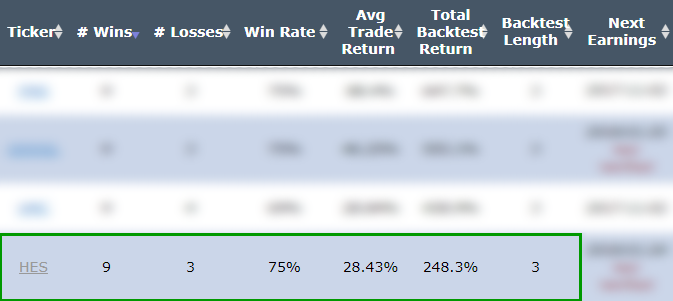
While we just looked at a multi-year back-test, we can also hone in on the most recent year with the same test:
Now we see a 81.4% return over the last year and a 75% win-rate.
➡ The average return for the last year per trade was 22.3% over 10-days.
➡ The average return for the last year per winning trade was 45.1% over 10-days.
➡ The return for losing trade was again, -45.9% over 10-days.
WHAT HAPPENED
This is it -- this is how people profit from the option market -- finding trading opportunities that avoid earnings risk and work equally well during a bull or bear market.
To see how to do this for any stock we welcome you to watch this quick demonstration video:
Tap Here to See the Tools at Work
Thanks for reading.
Risk Disclosure
You should read the Characteristics and Risks of Standardized Options.
Past performance is not an indication of future results.
Trading futures and options involves the risk of loss. Please consider carefully whether futures or options are appropriate to your financial situation. Only risk capital should be used when trading futures or options. Investors could lose more than their initial investment.
Past results are not necessarily indicative of future results. The risk of loss in trading can be substantial, carefully consider the inherent risks of such an investment in light of your financial condition.
Please note that the executions and other statistics in this article are hypothetical, and do not reflect the impact, if any, of certain market factors such as liquidity and slippage.
Optimizing Volatility Trades After Earnings in Hess Corporation
Hess Corporation (NYSE:HES): The Volatility Option Trade After Earnings
Date Published: 2017-11-8Author: Ophir Gottlieb
Disclaimer
The results here are provided for general informational purposes, as a convenience to the readers. The materials are not a substitute for obtaining professional advice from a qualified person, firm or corporation.
LEDE
This is a slightly advanced option trade that bets on volatility for a period that starts the day of Hess Corporation (NYSE:HES) earnings, which are reported before the market opens and lasts for the 10 calendar days to follow, that has been a winner for the last 3 years. We note the use of strict risk controls in this analysis and strict attention to earnings timing.
Hess Corporation (NYSE:HES) Earnings
The post-earnings moves in HES have been on our radar for a while, and we watched this time around to see yet another big move, so now we are publishing the pattern for Trade Machine Pro Members. This one requires detailed attention.
Here is a two-year stock return chart, where the blue "E" icons represent the earnings event. You can see how the stock does tend to move quite a bit for the 5-10 days after the announcement.
Simply owning options after earnings, blindly, is likely not a good trade, but hand-picking the times and the stocks to do it in can be useful. We can test this approach without bias with a custom option back-test. Here is the timing set-up around earnings:
Rules
* Open the long 40 delta strangle on the day of earnings, but at the close, after earnings are announced that morning.
* Close the strangle 10 calendar days after earnings -- don't let the option expire worthless.
* Use the options closest to 14 days from expiration (but at least 10-days).
This is a straight down the middle volatility bet -- this trade wins if the stock is volatile the week following earnings and it will stand to lose if the stock is not volatile. This is not a silver bullet -- it's a trade that needs to be carefully examined.
But, this is a stock direction neutral strategy, which is to say, it wins if the stock moves up or down -- it just has to move.
RISK CONTROL
Since blindly owning volatility can be a quick way to lose in the option market, we will apply a tight risk control to this analysis as well. We will add a 40% stop loss and a 40% limit gain.
In English, at the close of every trading day, if the strangle is up 40% from the price at the start of the trade, it gets sold for a profit. If it is down 40%, it gets sold for a loss.
DETAILS
For this back-test, the details matter. Two-things to note:
* The opening trade is made on the day of earnings, which are reported in the morning, but at the close, so the stock does have a full day to react first.
* The options are those that are closest to 14-days to expiration, so the closing trigger, if it's not a stop or a limit, is still well before expiration of those options -- it does not wait until those options decay to zero.
DISCOVERY
We started down the path of trade discovery by looking at the S&P 500, and the 7-day post-earnings straddles. We sorted by the most wins in the last 3-years, which led us to HES, and then we did our optimization (making it 10-days rather than 7, looking at two-week options rather one-week, and using a strangle rather than a straddle), by hand.
And here are the results:
RESULTS
If we bought the 40 delta strangle (bought the 40 delta call and bought the 40-delta put) in Hess Corporation (NYSE:HES) over the last three-years but only held it after earnings we get these results:
The mechanics of the TradeMachine™ are that it uses end of day prices for every back-test entry and exit (every trigger).
We see a 441% return, testing this over the last 12 earnings dates in Hess Corporation. That's a total of just 120 days (10 days for each earnings date, over 12 earnings dates).
Looking at Averages
The overall return was 441%; but the trade statistics tell us more with average trade results:
➡ The average return per trade was 43.8% over 10-days.
➡ The average return per winning trade was 51.9% over 10-days.
➡ The return for the losing trade was -45.9% over those 10-days.
Looking at the Last Year
While we just looked at a multi-year back-test, we can also hone in on the most recent year with the same test:
Now we see a 81.4% return over the last year and a 75% win-rate.
➡ The average return for the last year per trade was 22.3% over 10-days.
➡ The average return for the last year per winning trade was 45.1% over 10-days.
➡ The return for losing trade was again, -45.9% over 10-days.
WHAT HAPPENED
This is it -- this is how people profit from the option market -- finding trading opportunities that avoid earnings risk and work equally well during a bull or bear market.
To see how to do this for any stock we welcome you to watch this quick demonstration video:
Tap Here to See the Tools at Work
Thanks for reading.
Risk Disclosure
You should read the Characteristics and Risks of Standardized Options.
Past performance is not an indication of future results.
Trading futures and options involves the risk of loss. Please consider carefully whether futures or options are appropriate to your financial situation. Only risk capital should be used when trading futures or options. Investors could lose more than their initial investment.
Past results are not necessarily indicative of future results. The risk of loss in trading can be substantial, carefully consider the inherent risks of such an investment in light of your financial condition.
Please note that the executions and other statistics in this article are hypothetical, and do not reflect the impact, if any, of certain market factors such as liquidity and slippage.