International Business Machines Corp.


Why IBM's Business Looks So Ugly
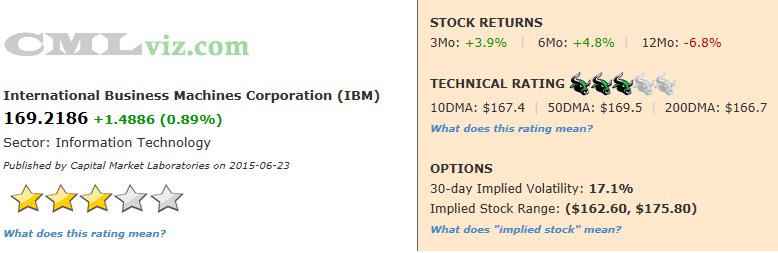
Fundamentals Technicals | Support: 165.34 | Resistance: 168.92 
In a raging bull market and a raging Internet of Things (IoT) segment, IBM stock is down over the last year and down double digits over the last two-years. Revenue (TTM) is now at levels not seen since 2006 (that's not a typo -- see chart below). Of all technology firms with market caps above $40 billion, IBM has the highest debt to equity by an absurd amount, more than doubling its nearest large cap peer. In fact, let's just look at a chart with mega cap technology that has equal spaced the companies on the x-axis (rank) and the debt/equity level in $ millions on the y-axis.

Click here to interact with this stock chart
Note that this relative to equity, so even though Apple has the largest debt of these firms, when scaled to equity, AAPL looks just fine.
But there's more. Net income (TTM) (aka after tax earnings) is at levels not seen since December 2008. R&D is at levels not seen since 2003 (we're talking about twelve years). The company has been borrowing money simply to buy its own stock, which has done nothing but raise debt levels. IBM is a mess.
![]()
IBM has a three bull (stock is range bound) technical rating because its trading above its 10- and 200-day moving averages, but below its 50- day moving average. We also note that the 10-day MA is below the 50-day MA ("swing death cross").
Here are the consensus estimates for next quarter. Note that last quarter's actual result is included at the far right and what do you know, the estimates are basically for no change at all.
| EARNINGS ESTIMATES | |||||
| Earnings Date | EPS | Revenue (Mean) | Revenue (Median) | Last Quarter (Actual) | |
| 2015-07-20 | $3.79 | $21,004.1 M | $20,877.5 M | $19,590.0 M | Provided by ZACKS |
Let's look at the core elements that drive the company's fundamental rating.
|
|
|
Fundamentals Rating Summary |
|
|
| METRIC | CURRENT | 1YR AGO | 2YR AGO | DIRECTION |
| Revenue (TTM US$ Millions) | 90,147 | 97,196 | 103,242 | FALLING |
| Operating Margin (QTR) | 1.211 | 1.35 | FALLING | |
| Net Income (TTM US$ Millions) | 11,966 | 15,835 | 16,570 | FALLING |
| Levered Free Cash Flow (TTM US$ Millions) | 12,503 | 11,115 | 15,184 | RISING |
| Research and Development (US$ Millions) | 1,298 | 1,452 | FALLING | |
| Research and Development Expense/Revenue | 0.066 | 0.053 | RISING | |

|
|
| Stock Returns and Chart |
|
|
Before we dig into the fundamental trends that drive the rating, let's look at a two-year stock chart with regression channel and 10-day momentum (on the bottom).

Click here to interact with this stock chart
Now let's examine the visualizations of the critical financial measures.

| METRIC | CURRENT | 1YR AGO | 2YR AGO | DIRECTION |
| Revenue (TTM US$ Millions) | 90,147 | 97,196 | 103,242 | FALLING |
Revenue over the trailing twelve months (TTM) is down -7.3% from a year ago and it's down -12.7% from two-years ago. But check out the revenue (TTM) chart below. Revenue is at levels ot seen since 2006 (drawn in yellow).
What do all these numbers mean?
IBM's fundamental rating was hit hard by these results:
1. The one-year change was negative.
2. The two-year change was negative.
Let's look at Revenue (TTM US$ Millions) in the chart below (note the yellow line drawn back to the last time revenue as this low).

Click Here to Interact With This Chart
| METRIC | CURRENT | 1YR AGO | 2YR AGO | DIRECTION |
| Net Income (TTM US$ Millions) | 11,966 | 15,835 | 16,570 | FALLING |
It's not just revenue that's at multi-year lows. Net income (TTM) is lower than it has ever been since 2008. Net Income is down an atrocious 24.4% year-over-year and 27.8% over the last two-years.
In our next chart we plot Net Income (TTM US$ Millions) in the blue bars and the quarterly results in the gold line. Note the collapsing bars from a year ago (four quarters ago).

Click Here to Interact With This Chart
Let's skip free cash flow (which was higher in 2009 after the great recession than it is now) and move onto perhaps an even more disturbing trend, R&D.
| METRIC | CURRENT | 1YR AGO | 2YR AGO | DIRECTION |
| Research and Development (US$ Millions) | 1,298 | 1,452 | FALLING |
Research and Development (US$ Millions) in the most recent quarter for IBM was $1.3 billion. That's down 10.6% from last year's level. Even worse, the company hasn't spent less on R&D since 2003 (see chart below).
In our final time series chart we plot Research and Development (US$ Millions) in the blue bars.

Click Here to Interact With This Chart
|
|
| Tale of the Tape |
|
|
Not to pick on IBM, but for a little context let's compare it Intel and Microsoft in one final image that gives us nine crtical metrics.

Click here to interact with this chart
Across the top row we can see measures of size and we can just skip those for now. The information lies in the second two rows. Across row two we can see that IBM has the lowest gross margin %, net income margin % and yet spends less on R&D than its peers per dollar of expense. basically its just worse at everything and it's not because it's investing in the company's future. The final row really tells the entire story, though.
IBM has shrinking revenue, shrinking earnings and for that reality is given the lowest price to sales of the peers. In English, every $1 of revenue for IBM is worth $1.76 in market cap. For MSFTm that same dollar is worth $3.50 in market cap and for Intel that dollar is worth $2.71 in market cap.
Summary
It was the rage of social media to beat up on Dick Costello for growing Twitter from a $3b market cap to a $22 billion. Fair enough, he didn't deliver on projections and that was a huge disappointment. No qualms, he's a CEO, replace him if needed. But IBM feels stuck. In fact, stuck would be better than where it is. Stuck would mean 0% return over the last two-years as opposed to negative 12%. Stuck would mean steady revenue, earnings and R&D. But all are at multi-year lows if not decade lows.
IBM delivers $12.5 billion a year in free cash flow. There's isn't any solvency risk at all. But someone, please do something with this company. Shake it up, break it up, wake it up. Because for right now, a company with some great people is simply dying. It just is.