Symbol not found


Why LinkedIn Has Broken Free of Facebook and Its Stock May Rise
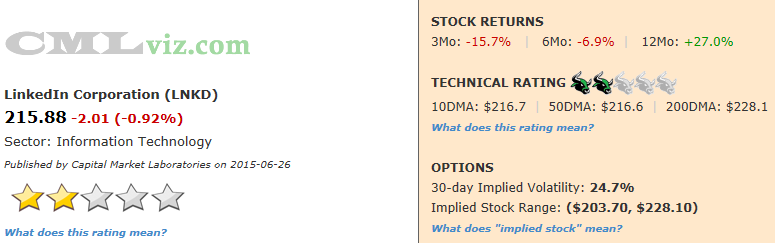
Fundamentals Technicals | Support: 215.7 | Resistance: 217.95 
LinkedIn falls into the social media category, but it does offer a different and compelling use case for the space. While Twitter battles to show advertisers a value proposition that is differentiated from Facebook and Google, LNKD has clearly set itself apart. It has become the de-facto business card for individuals and the defacto job search platform. We could justy as easily call its competitor Monster Worldwide (MWW). We'll dive deeper into this in the body of this article, but LNKD makes money in three different ways and two of them are totally separate from the world of Google and Facebook; the two-headed behemoth that own nearly 90% of on-line advertising. That is very compelling and very differentiated.
One great image that illustrates LNKD's differentiation from the rest of essentially all of technology is through gross margin %. Below we have included all technology companies above $25 billion in market cap, equal space the x-axis (rank) and plotted gross margin % on the y-axis.

Click Here To Interact With This Image
We can see that other than Priceline (PCLN), LinkedIn has the largest gross margin %, even better than Facebook (FB).
The company missed revenue projections last quarter and stock jolted down from $252 to $205 on the day following earnings and has climbed back up a bit, but certainly has not filled the gap.
The company reported lighter than expected forecasts for the year, with revenue estimated to be $2.90 billion for the full year, down from Wall St. expectations of $2.98 billion. The explanation was pretty palatable as it involved a big currency rate hit ($50 million), costs associated with integrating Lynda.com, and finally advertising rate drops in Europe. The price paid for growth in the market right now is astonishingly high (see Facebook), and so the double edged sword reveals itself when a company misses its growth estimates.
LNKD's revenue (TTM) has risen for every quarter since its been public, making eighteen consecutive quarters (that's the annual number, not the quarterly number). While earnings are negative and falling huge, free cash flow has steadied and is now positive. There's no doubt that the fundamentals look weak, but the growth story is compelling.
![]()
LNKD has a two bull (low rating) technical rating because it's trading below the 10-day (short-term), 50-day (medium-term) and 200-day (long-term) moving averages. The fact that the 10-day MA is above the 50-day MA ("swing golden cross") does bring the technical rating up from the lowest rung.
Here are the consensus estimates for next quarter. Note that last quarter's actual result is included at the far right. The newly revised estimates have LNKD beating last quarter by ~$50 million.
| EARNINGS ESTIMATES | |||||
| Earnings Date | EPS | Revenue (Mean) | Revenue (Median) | Last Quarter (Actual) | |
| 2015-07-30 | $-0.53 | $681.4 M | $680.8 M | $637.7 M | Provided by ZACKS |
Let's look at the core elements that drive the company's fundamental rating.
|
|
|
Fundamentals Rating Summary |
|
|
| METRIC | CURRENT | 1YR AGO | 2YR AGO | DIRECTION |
| Revenue (TTM US$ Millions) | 2,383 | 1,677 | 1,109 |  |
| Operating Margin (QTR) | 0.974 | 1.00 | 1.08 | FALLING |
| Net Income (TTM US$ Millions) | -45 | -9 | 39 |  |
| Levered Free Cash Flow (TTM US$ Millions) | 92 | 28 | 123 | RISING |
| Research and Development (US$ Millions) | 166 | 121 | 81 | |
| Research and Development Expense/Revenue | 0.260 | 0.255 | 0.248 | RISING |

|
|
| Stock Returns and Chart |
|
|
Before we dig into the fundamental trends that drive the rating, let's look at a two-year stock chart with regression channel and 10-day momentum (on the bottom).

Click here to interact with this stock chart
Now let's examine the visualizations of the critical financial measures.

| METRIC | CURRENT | 1YR AGO | 2YR AGO | DIRECTION |
| Revenue (TTM US$ Millions) | 2,383 | 1,677 | 1,109 | |
Revenue (TTM) is trending higher meaning that it has increased for at least five consecutive quarters (eighteen in this case). LNKD is growing revenue by 42% year-over-year and 115% over the last two-years. That's huge. Any number over 20% for a one-year change has an added impact on the fundamental (star) rating.
One thing to note before we look to the chart is that for the first time ever, LNKD showed a quarterly decline in revenue, but oddly that was known well ahead of time and had nothing to do with the stock drop.
So how does LNKD make money?
This is the beautiful part. LinkedIn makes money in essentially three ways: (1) Recruitment services (sold to both professional recruiters and employers) (2) Advertising (3) Premium subscriptions. This is beautiful because items (1) and (3) are totally different from all other social media. Other than on the fringes, LNKD doesn't have to deal with Google and Facebook, the two companies eating Twitter's lunch.
What do all these numbers mean?
LNKD's fundamental rating benefited these results:
1. The one-year change was positive.
2. The one-year change was greater than +20% (an extra boost to the rating).
3. The two-year change was positive.
Finally, the up trend (consecutive quarters) in revenue benefited the fundamental (star) rating.
Let's look at Revenue (TTM US$ Millions) in the chart below.

Click Here to Interact With This Chart
| METRIC | CURRENT | 1YR AGO | 2YR AGO | DIRECTION |
| Net Income (TTM US$ Millions) | -45 | -9 | 39 | |
For the bulls, this is going to be a tough section to read. Net Income (after tax profit) over the trailing twelve months (TTM) for LNKD is falling and is now a loss of $45 million. In fact, net income (TTM) (aka annual earnings) is trending lower meaning that annual earnings have decreased for at least five consecutive quarters (eight in this case). Even further, the $45 annual loss is essentially all due to last quarter's result of -$42 million. It gets worse, yet. The full year projections were taken down to $1.90 EPS, down from $3.03 EPS. Ouch... a lot.
In our next chart we plot Net Income (TTM US$ Millions) in the blue bars and the quarterly results in the gold line.

Click Here to Interact With This Chart
| METRIC | CURRENT | 1YR AGO | 2YR AGO | DIRECTION |
| Levered Free Cash Flow (TTM US$ Millions) | 92 | 28 | 123 | RISING |
Levered Free Cash Flow (FCF) (TTM US$ Millions) is a critical determinant of stock price since market cap is the present value of all future free cash flows. For LNKD the metric is rising, up 233% year-over-year. The company has recovered from a string of negative FCF numbers and does seem to have this critical measure back under control. We note that this cash metric is down $31 million from $123 million, two-years ago.
For our next chart we plot Levered Free Cash Flow (TTM US$ Millions) in the blue bars through time.

Click Here to Interact With This Chart
| METRIC | CURRENT | 1YR AGO | 2YR AGO | DIRECTION |
| Research and Development (US$ Millions) | 166 | 121 | 81 | |
This is a pretty cool metric for LinkedIn. Research and Development (R&D) (US$ Millions) is trending higher meaning that for at least five consecutive quarters, it's been rising. In fact, it has risen for 23 consecutive quarters, each time to a new all-time high. R&D is up 37% year-over-year and 105% over the last two-years. The company has places to invest, and that means places to grow.
R&D per dollar of revenue for the latest quarter is $0.260. Last year this measure was $0.255 (so it's quite steady).
In our final time series chart we plot Research and Development (US$ Millions) in the blue bars.

Click Here to Interact With This Chart
Summary
LinkedIn finds itself in the social media realm, but beautifully generating revenue in multiple ways outside of Facebook's reach. I don't even know if there is a social media out there that charges premium subscriptions. The company has over 330 million users, has a huge international presence that's growing and even better, as a job board, it's core business is sticky and difficult to replace.
The bullish thesis for LNKD is that the differentiated social sphere it has created around jobs, employment and training is truly unique, sustainable and "growable." The bearish thesis is the reality of the company today, which includes collapsing earnings, falling operating margins and falling forecasts.