Marvell Technology Inc
XNAS:MRVL 4:00:00 PM EDT
196.33
+5.64
(+2.96%)
7:59:59 PM EDT: $195.20 -1.13 (-0.58%)


Marvell Technology Group Ltd., MRVL, earnings, option, bullish

Preface
There is a bullish momentum pattern in Marvell Technology Group Ltd. (NASDAQ:MRVL) stock 7 calendar days before earnings, and we can capture that phenomenon explicitly by looking at returns in the option market. The strategy won't work forever, but for now it is a momentum play that has not only returned 193.2%, but has also shown a win-rate of 75%.
Marvel has earnings due out on 8-24-2017 according to NASDAQ. Seven days before 8-24 would be 8-17.
LOGIC
The logic behind the option trading backtest is easy to understand -- in a bull market there can be a stock rise ahead of earnings on optimism, or upward momentum, that sets in the one-week before an earnings date. Now we can see it in Marvell Technology Group Ltd..
The Bullish Option Trade Before Earnings in Marvell Technology Group Ltd.
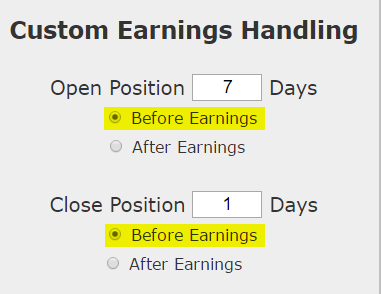
We will examine the outcome of getting long the call option nearest to 14-days from expiration (but after earnings) in Marvell Technology Group Ltd. 7-days before earnings (using calendar days) and selling the call before the earnings announcement.
Here's the set-up in great clarity; again, note that the trade closes before earnings, so this trade does not make a bet on the earnings result.
RISK CONTROL
We will add a standard risk control to the back-test by adding a 40% stop and 40% limit on the test:
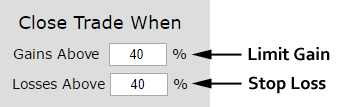
In English, if the trade ever shows a 40% gain or a 40% loss before the closing date, the position was exited.
STOCK CHART
Here is a two-year stock return chart for MRVL -- the blue "E" icons represent earnings dates.
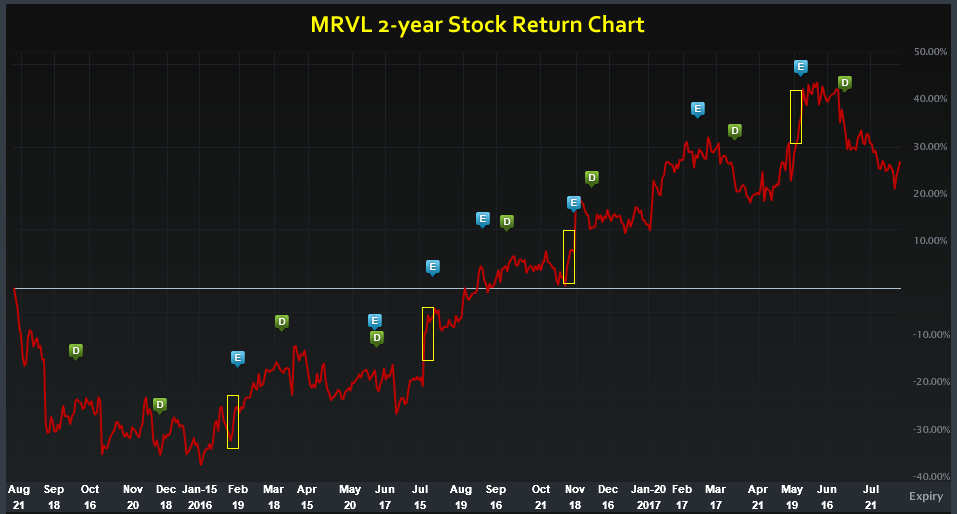
We have highlighted some of the pre-earnings run-ups for clarity. Marvell Technology Group Ltd. is a semiconductor provider of application-specific standard products.
RESULTS
Here are the results over the last two-years in Marvell Technology Group Ltd.:
We see a 183% return, testing this over the last 8 earnings dates in Marvell Technology Group Ltd. That's a total of just 56 days (7-days for each earnings date, over 8 earnings dates). This has been the results of following the trend of bullish sentiment into earnings while avoiding the actual earnings result.
We can also see that this strategy hasn't been a winner all the time, rather it has won 6 times and lost 2 times, for a 75% win-rate. The trade will lose sometimes, but over the most recent trading history, this momentum and optimism options trade has won ahead of earnings.
Setting Expectations
While this strategy had an overall return of 183%, the trade details keep us in bounds with expectations:
➡ The average percent return per trade was 39%.
➡ The average percent return per winning trade was 67%.
➡ The average percent return per losing trade was -46%.
It's this general set-up that we are after:
* Trades that have won much more often than they have lost (in this case 6 wins to 2 losses or a 3:1 ratio).
* Trades where the winners have had a greater gain than the losers (in this case 67% versus -46%).
It's not magic or a guarantee, it's methodical approach to trading options. Traders without access to this information may feel uncomfortable -- it's a glaring example of how the top 0.1% have been dissecting retail traders for decades. But its objective data - this is how option professionals find the edge they require to keep going.
Back-testing More Time Periods in Marvell Technology Group Ltd.
Now we can look at just the last year as well:
We're now looking at 143% returns, on 3 winning trades and 1 losing trades.
➡ The average percent return over the last year per trade was 40%.
➡ The average percent return over the last year per winning trade was 68%.
➡ The percent return over the last year for the losing trade was -44%.
Again, this is generally the idea: Take a trade that wins more often than it loses and where the gains for the winning trades are also larger than the losses from the losing trades. Creating portfolio of these types of results will create edge.
WHAT HAPPENED
Bull markets tend to create optimism, whether it's deserved or not. This has been a tradable phenomenon in Momo Inc. To see how to test this for any stock we welcome you to watch this quick demonstration video:
Tap Here to See the Tools at Work
Risk Disclosure
You should read the Characteristics and Risks of Standardized Options.
Past performance is not an indication of future results.
Trading futures and options involves the risk of loss. Please consider carefully whether futures or options are appropriate to your financial situation. Only risk capital should be used when trading futures or options. Investors could lose more than their initial investment.
Past results are not necessarily indicative of future results. The risk of loss in trading can be substantial, carefully consider the inherent risks of such an investment in light of your financial condition.
The One-Week Pre-earnings Momentum Trade With Options in Marvell Technology Group Ltd.
Marvell Technology Group Ltd. (NASDAQ:MRVL) : The One-Week Pre-earnings Momentum Trade With Options
Date Published: 2017-08-15Author: Ophir Gottlieb
Preface
There is a bullish momentum pattern in Marvell Technology Group Ltd. (NASDAQ:MRVL) stock 7 calendar days before earnings, and we can capture that phenomenon explicitly by looking at returns in the option market. The strategy won't work forever, but for now it is a momentum play that has not only returned 193.2%, but has also shown a win-rate of 75%.
Marvel has earnings due out on 8-24-2017 according to NASDAQ. Seven days before 8-24 would be 8-17.
LOGIC
The logic behind the option trading backtest is easy to understand -- in a bull market there can be a stock rise ahead of earnings on optimism, or upward momentum, that sets in the one-week before an earnings date. Now we can see it in Marvell Technology Group Ltd..
The Bullish Option Trade Before Earnings in Marvell Technology Group Ltd.
We will examine the outcome of getting long the call option nearest to 14-days from expiration (but after earnings) in Marvell Technology Group Ltd. 7-days before earnings (using calendar days) and selling the call before the earnings announcement.
Here's the set-up in great clarity; again, note that the trade closes before earnings, so this trade does not make a bet on the earnings result.
RISK CONTROL
We will add a standard risk control to the back-test by adding a 40% stop and 40% limit on the test:
In English, if the trade ever shows a 40% gain or a 40% loss before the closing date, the position was exited.
STOCK CHART
Here is a two-year stock return chart for MRVL -- the blue "E" icons represent earnings dates.
We have highlighted some of the pre-earnings run-ups for clarity. Marvell Technology Group Ltd. is a semiconductor provider of application-specific standard products.
RESULTS
Here are the results over the last two-years in Marvell Technology Group Ltd.:
We see a 183% return, testing this over the last 8 earnings dates in Marvell Technology Group Ltd. That's a total of just 56 days (7-days for each earnings date, over 8 earnings dates). This has been the results of following the trend of bullish sentiment into earnings while avoiding the actual earnings result.
We can also see that this strategy hasn't been a winner all the time, rather it has won 6 times and lost 2 times, for a 75% win-rate. The trade will lose sometimes, but over the most recent trading history, this momentum and optimism options trade has won ahead of earnings.
Setting Expectations
While this strategy had an overall return of 183%, the trade details keep us in bounds with expectations:
➡ The average percent return per trade was 39%.
➡ The average percent return per winning trade was 67%.
➡ The average percent return per losing trade was -46%.
It's this general set-up that we are after:
* Trades that have won much more often than they have lost (in this case 6 wins to 2 losses or a 3:1 ratio).
* Trades where the winners have had a greater gain than the losers (in this case 67% versus -46%).
It's not magic or a guarantee, it's methodical approach to trading options. Traders without access to this information may feel uncomfortable -- it's a glaring example of how the top 0.1% have been dissecting retail traders for decades. But its objective data - this is how option professionals find the edge they require to keep going.
Back-testing More Time Periods in Marvell Technology Group Ltd.
Now we can look at just the last year as well:
We're now looking at 143% returns, on 3 winning trades and 1 losing trades.
➡ The average percent return over the last year per trade was 40%.
➡ The average percent return over the last year per winning trade was 68%.
➡ The percent return over the last year for the losing trade was -44%.
Again, this is generally the idea: Take a trade that wins more often than it loses and where the gains for the winning trades are also larger than the losses from the losing trades. Creating portfolio of these types of results will create edge.
WHAT HAPPENED
Bull markets tend to create optimism, whether it's deserved or not. This has been a tradable phenomenon in Momo Inc. To see how to test this for any stock we welcome you to watch this quick demonstration video:
Tap Here to See the Tools at Work
Risk Disclosure
You should read the Characteristics and Risks of Standardized Options.
Past performance is not an indication of future results.
Trading futures and options involves the risk of loss. Please consider carefully whether futures or options are appropriate to your financial situation. Only risk capital should be used when trading futures or options. Investors could lose more than their initial investment.
Past results are not necessarily indicative of future results. The risk of loss in trading can be substantial, carefully consider the inherent risks of such an investment in light of your financial condition.