Netflix Inc.
XNAS:NFLX
86.02
-0.34
(-0.39%)
7:59:58 PM EDT: $86.01 -0.01 (-0.01%)


Netflix Inc, NFLX, bullish, options, 90/40 delta, call spread, TTM Technical Squeeze

Disclaimer
The results here are provided for general informational purposes, as a convenience to the readers. The materials are not a substitute for obtaining professional advice from a qualified person, firm or corporation.
LEDE
This is a technical analysis triggered momentum trade that bets on a bullish move in the underlying stock for a period that starts the day Netflix Inc (NASDAQ:NFLX) triggers a breakout from the TTM Squeeze signal and lasts until two-days in a row show reversed (bearish) momentum. It has been a winner for the last 5 years.
UPDATE: 12-7-2017
According to the CML Trade Machine Pro scanner, Netflix is in a possible breakout if it closes above $186.05. The price as of this writing, 12-7-2017 11:28PM PST is $186.78. If the stock closes below $186.05, this does not trigger.
You can see that trigger alert here:
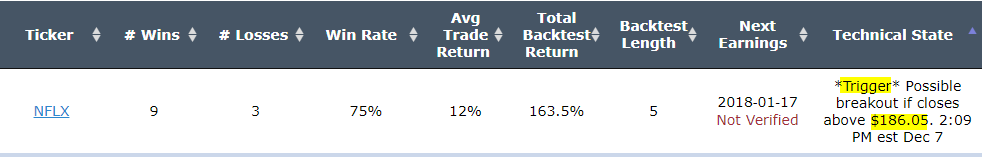
Netflix Inc (NASDAQ:NFLX) IDEA: TTM Squeeze Technical Trigger
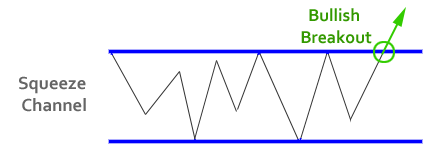
The idea is simple -- stocks tend to move in tight ranges for the majority of the time, and then they move in bursts for the remaining periods. The breakout from the TTM Squeeze attempts to find these bursts.
Here is a simple graphic, where the gray line is the daily stock price, the blue bars comprise the tight squeeze zone, and then we see the break out into a bearish move. Roughly speaking, this is the pattern that this technical indicator is attempting to identify and back-test. The squeeze period must last at least 6-trading days for it to register as a squeeze.
Rules
* Open the long 90/40 delta call spread on the day the TTM Squeeze has been broken with upside momentum.
* Close the call after that signal has seen a consecutive two-day reversal.
* Use the options closest to 15 days from expiration.
* Never trade earnings -- irrespective of the technical indicator, this trade will close 2-days before a scheduled earnings announcement.
This is a straight down the middle bullish bet -- this trade wins if the stock rises and will lose if the stock does not.
RESULTS
Owning the 90/40 delta call spread in Netflix Inc (NASDAQ:NFLX) over the last five-years but only held it after a TTM Squeeze was triggered we get these results:
Tap Here to See the Back-test
The mechanics of the TradeMachine™ are that it uses end of day prices for every back-test entry and exit (every trigger).
We see a 140% back-test return, which is based on 13 trades in Netflix Inc. A bullish breakout from the TTM Squeeze is a technical signal that doesn't happen often, but rather is designed to mechanically identify the times when a stock is in a low volatility period and may be about to thrust higher. It's a signal based on probabilities, not absolutes, so it won't work all the time.
Looking at Averages
The overall return was 140%; but the trade statistics tell us more with average trade results:
➡ The average return per trade was 6.52%.
➡ The average return per winning trade was 35.17%.
➡ The average return per losing trade was -57.93%.
Advanced Option Analysis
The choice of deltas, in this case the 90/40 call spread, was not an accident. We objectively, empirically, and explicitly checked various combinations for a call spread using the bull squeeze breakout and found this one to be the best.
This is a clever and advanced way to empirically test a bullish signal and that is exactly what we have done. The returns over the last five-years over the 270 most liquid option names showed a return that was higher than simply buying a call spread with statistical significance of nearly 99%.
Technical Details
For the details about the TTM Squeeze, how it works, when it's triggered and what it means, you can read our dossier The details behind the TTM Squeeze Technical Indicator .
WHAT HAPPENED
To see how to test this for any stock we welcome you to watch this quick demonstration video:
Tap Here to See the Tools at Work
Risk Disclosure
You should read the Characteristics and Risks of Standardized Options.
Past performance is not an indication of future results.
Trading futures and options involves the risk of loss. Please consider carefully whether futures or options are appropriate to your financial situation. Only risk capital should be used when trading futures or options. Investors could lose more than their initial investment.
Past results are not necessarily indicative of future results. The risk of loss in trading can be substantial, carefully consider the inherent risks of such an investment in light of your financial condition.
Please note that the executions and other statistics in this article are hypothetical, and do not reflect the impact, if any, of certain market factors such as liquidity and slippage.
The Bullish Technical TTM Squeeze With Options in Netflix Inc
Netflix Inc (NASDAQ:NFLX) : The Bullish Technical TTM Squeeze With Options
Date Published: 2017-12-07Author: Ophir Gottlieb
Disclaimer
The results here are provided for general informational purposes, as a convenience to the readers. The materials are not a substitute for obtaining professional advice from a qualified person, firm or corporation.
LEDE
This is a technical analysis triggered momentum trade that bets on a bullish move in the underlying stock for a period that starts the day Netflix Inc (NASDAQ:NFLX) triggers a breakout from the TTM Squeeze signal and lasts until two-days in a row show reversed (bearish) momentum. It has been a winner for the last 5 years.
UPDATE: 12-7-2017
According to the CML Trade Machine Pro scanner, Netflix is in a possible breakout if it closes above $186.05. The price as of this writing, 12-7-2017 11:28PM PST is $186.78. If the stock closes below $186.05, this does not trigger.
You can see that trigger alert here:
Netflix Inc (NASDAQ:NFLX) IDEA: TTM Squeeze Technical Trigger
The idea is simple -- stocks tend to move in tight ranges for the majority of the time, and then they move in bursts for the remaining periods. The breakout from the TTM Squeeze attempts to find these bursts.
Here is a simple graphic, where the gray line is the daily stock price, the blue bars comprise the tight squeeze zone, and then we see the break out into a bearish move. Roughly speaking, this is the pattern that this technical indicator is attempting to identify and back-test. The squeeze period must last at least 6-trading days for it to register as a squeeze.
Rules
* Open the long 90/40 delta call spread on the day the TTM Squeeze has been broken with upside momentum.
* Close the call after that signal has seen a consecutive two-day reversal.
* Use the options closest to 15 days from expiration.
* Never trade earnings -- irrespective of the technical indicator, this trade will close 2-days before a scheduled earnings announcement.
This is a straight down the middle bullish bet -- this trade wins if the stock rises and will lose if the stock does not.
RESULTS
Owning the 90/40 delta call spread in Netflix Inc (NASDAQ:NFLX) over the last five-years but only held it after a TTM Squeeze was triggered we get these results:
| NFLX: Long 90/40 Delta Call Spread
Signal: TTM Technical Squeeze |
|||
| % Wins: | 69% | ||
| Wins: 9 | Losses: 4 | ||
| % Return: | 140% | ||
Tap Here to See the Back-test
The mechanics of the TradeMachine™ are that it uses end of day prices for every back-test entry and exit (every trigger).
We see a 140% back-test return, which is based on 13 trades in Netflix Inc. A bullish breakout from the TTM Squeeze is a technical signal that doesn't happen often, but rather is designed to mechanically identify the times when a stock is in a low volatility period and may be about to thrust higher. It's a signal based on probabilities, not absolutes, so it won't work all the time.
Looking at Averages
The overall return was 140%; but the trade statistics tell us more with average trade results:
➡ The average return per trade was 6.52%.
➡ The average return per winning trade was 35.17%.
➡ The average return per losing trade was -57.93%.
Advanced Option Analysis
The choice of deltas, in this case the 90/40 call spread, was not an accident. We objectively, empirically, and explicitly checked various combinations for a call spread using the bull squeeze breakout and found this one to be the best.
This is a clever and advanced way to empirically test a bullish signal and that is exactly what we have done. The returns over the last five-years over the 270 most liquid option names showed a return that was higher than simply buying a call spread with statistical significance of nearly 99%.
Technical Details
For the details about the TTM Squeeze, how it works, when it's triggered and what it means, you can read our dossier The details behind the TTM Squeeze Technical Indicator .
WHAT HAPPENED
To see how to test this for any stock we welcome you to watch this quick demonstration video:
Tap Here to See the Tools at Work
Risk Disclosure
You should read the Characteristics and Risks of Standardized Options.
Past performance is not an indication of future results.
Trading futures and options involves the risk of loss. Please consider carefully whether futures or options are appropriate to your financial situation. Only risk capital should be used when trading futures or options. Investors could lose more than their initial investment.
Past results are not necessarily indicative of future results. The risk of loss in trading can be substantial, carefully consider the inherent risks of such an investment in light of your financial condition.
Please note that the executions and other statistics in this article are hypothetical, and do not reflect the impact, if any, of certain market factors such as liquidity and slippage.