


Netflix Crushed Its Last Two Earnings -- Here's What That Means for the Next One
Netflix Inc (NASDAQ:NFLX) : Trading Earnings Optimism With Options
Date Published: 2018-06-16
Disclaimer
The results here are provided for general informational purposes, as a convenience to the readers. The materials are not a substitute for obtaining professional advice from a qualified person, firm or corporation.
PREFACE
While we have shown that a pre-earnings momentum pattern has emerged in the Nasdaq 100 stocks that has persisted during the great recession and all the way through this decade long bull market, there is one extra piece of information that has indicated this same signal with even stronger conviction -- a huge earnings beat.
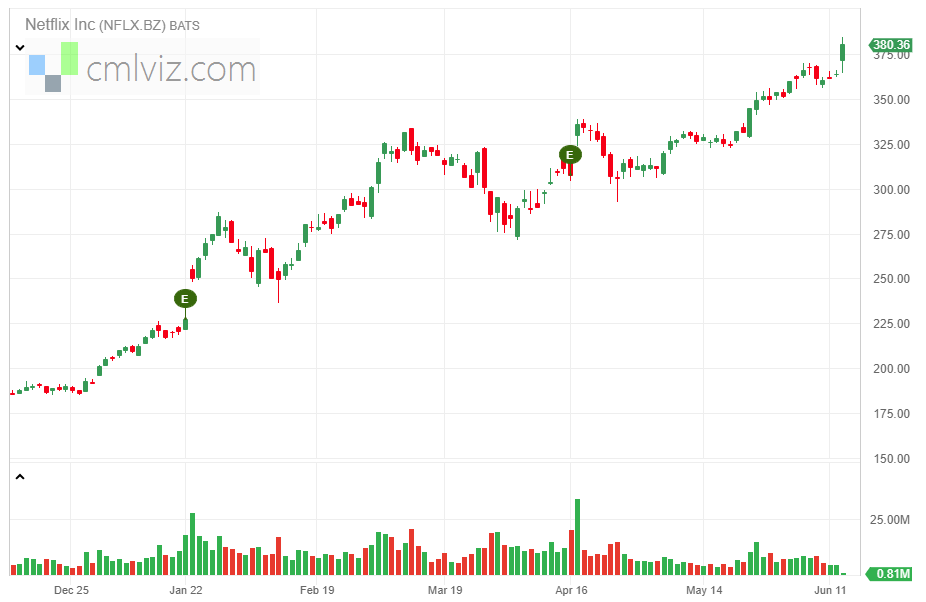
Netflix last reported earnings on 4-16-2018 and the stock ripped off of earnings, going from $307.78 to $336.06, or a 9.2% rise. One quarter before that, Netflix also crushed earnings reported on 1-22-2018, with the stock rising from $227.58 to $250.29 in one day (+9.9%).
Here is a six-month stock chart:
While all of the attention is on the those earning moves -- that's not the repeating pattern over the last few years -- it's something much more subtle, and something that has been even more powerful.
PREMISE
The premise is simple -- one of the least recognized but most important phenomena surrounding this bull market is the amount of optimism, or upward momentum, that sets in the two-weeks before an earnings announcement following a prior quarter earnings beat.
We see a very similar in Apple, which we discussed in our recent dossier How to Trade Apple After an Earnings Rip.
Let's look at the results of buying a three-week call option in Netflix Inc two-weeks before earnings (using calendar days) and selling the call before the earnings announcement if and only if the prior earnings move was a large move higher.
Here's the set-up in great clarity; again, note that the trade closes before earnings since Netflix reports after the market closes, so this trade does not make a bet on the earnings result.
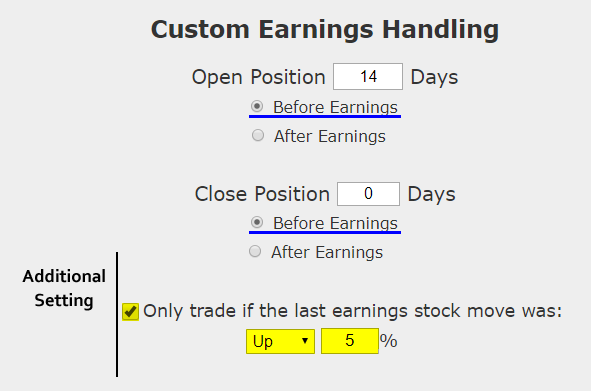
Here are the results over the last two-years in Netflix Inc of this two-week momentum back-test if and only if the stock made a 5% or larger move off of earnings in the prior quarter.
| NFLX: Long 40 Delta Call | |||
| % Wins: | 100% | ||
| Wins: 3 | Losses: 0 | ||
| % Return: | 529% | ||
Tap Here to See the Back-test
The mechanics of the TradeMachine® Stock Option Backtester are that it uses end of day prices for every back-test entry and exit (every trigger).
Track this trade idea. Get alerted for ticker `NFLX` 14 days before earnings
We see a529% return, testing this over the last 8 earnings dates in Netflix Inc and see that it has only triggered 3 times.
The trade will lose sometimes, but over the most recent trading history, this momentum and optimism coupled with a prior earnings beat has won ahead of earnings.
Setting Expectations
While this strategy had an overall return of 529%, the trade details keep us in bounds with expectations:
➡ The average percent return per trade was 132% over each 15-day period.
Checking More Time Periods in Netflix Inc
Now we can look at just the last year as well:
➡ The average percent return over the last year per trade was 189.9% over each of the two 15-day periods.
WHAT HAPPENED
There's a lot less luck to successful option trading than most people realize. To learn more about empirical option trading we welcome you to watch this quick demonstration video:
Tap Here to See the Tools at Work
Risk Disclosure
You should read the Characteristics and Risks of Standardized Options.
Past performance is not an indication of future results.
Trading futures and options involves the risk of loss. Please consider carefully whether futures or options are appropriate to your financial situation. Only risk capital should be used when trading futures or options. Investors could lose more than their initial investment.
Past results are not necessarily indicative of future results. The risk of loss in trading can be substantial, carefully consider the inherent risks of such an investment in light of your financial condition.
Please note that the executions and other statistics in this article are hypothetical, and do not reflect the impact, if any, of certain market factors such as liquidity and slippage.