


High Win Rate Trigger - How to Trade When It Hits Technical Failure in Nike (NKE)
High Win Rate Trigger - How to Trade When It Hits Technical Failure in Nike (NKE)
Date Published: 2019-09-04
Disclaimer
The results here are provided for general informational purposes from the CMLviz Trade Machine Stock Option Backtester as a convenience to the readers. The materials are not a substitute for obtaining professional advice from a qualified person, firm or corporation.Lede
In today's dossier we look at how to trade a blue chip stock, in this case Nike (NKE), when it hits technical failure, seeking high win rates for a short-term option trade.Preface
Most traders have felt it -- the urge to put on a bullish trade when a blue chip stock starts to hit a hard down trend and breaks through technical support.Today we show the empirical results of doing just that with Nike (NYSE:NKE), and how it has worked only over the last 10-years.
You are either flexible to new trade analytics to find historically winning patterns through difficult market periods, or you are not. That's it.
The Trade that Looks for a Reversal in a Blue Chip
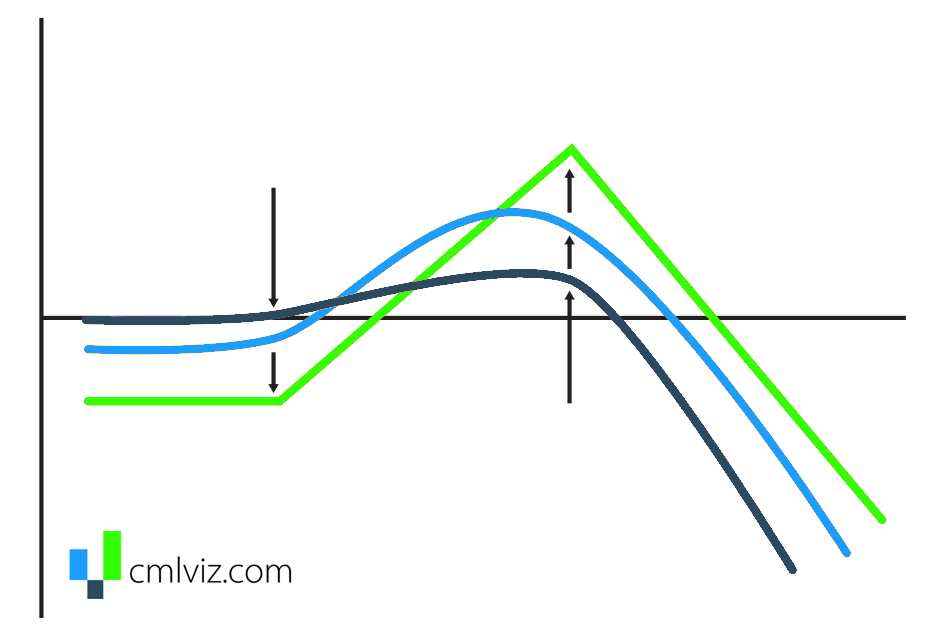
Today we examine the outcome of selling an out of the money put spread (selling the 40-delta put and buying the 20-delta put) that are closest to 7-days from expiration on the day that NKE stock crosses below the 200-day moving average.The only rules for entry are the standard "Never Trade Earnings" rules from Trade machine, which means the trade does not open if it is 2-days or less before earnings and does not open any earlier than 2-days after earnings.
You can think of it as a 4-day black out period around earnings.
The exit rule calls for a 50% limit, which means that if the credit from the put spread shrinks to half of its value (that would be a winning trade), it is closed at the end of the trading day. That's it.
10-years: Nike Option Backtester Results With Technical Analysis
Here are the results of this strategy over the last ten-years.| NKE: Short 40/20 Weekly Put Spread | |||
| % Wins: | 85.3% | ||
| Wins: 29 | Losses: 5 | ||
| % Return: | 201% | ||
Tap Here to See the Back-test
The mechanics of the TradeMachine® stock option backtester are that it uses end of day prices for every back-test entry and exit (every trigger).
Managing Expectations
While this trade has a total back-test return of 201%, the average trade return over the last 10-years was 11.5% for every weekly period.Nike Option Backtester Results With Technical Analysis
Here are the results over the last year in NKE:| NKE: Short 40/20 Weekly Put Spread | |||
| % Wins: | 87.5% | ||
| Wins: 7 | Losses: 7 | ||
| % Return: | 114% | ||
Tap Here to See the Back-test
The mechanics of the TradeMachine® stock option backtester are that it uses end of day prices for every back-test entry and exit (every trigger).
Managing Expectations
While this trade has a total back-test return of 114%, the average trade return over the last years was 20.0% for every weekly period.Example Backtest
The last time this triggered was 8-23-2019, so less than two-weeks since the original publication of this article.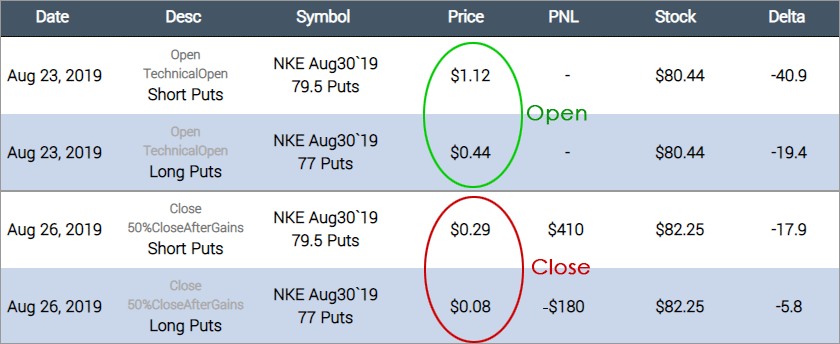
To break it down:
On 8-23-2019, NKE crossed below its 200-day SMA. The trade opened with a short put spread, selling the Aug30 79.5 puts @ $1.12 and buying the Aug30 77 puts for $0.44, yielding a net credit of $0.68. If that spread went down in value by half to $0.34, that would be enough to trigger a close.
On 8-26-2019, with the stock price rising a bit, that put spread shrank to $0.21 and was closed:
Buy to the close the Aug30 79.5 puts for $0.29 and sell to close the Aug30 77 puts @ $0.08, for a net debit of $0.21.
That means the trade opened for $0.68, was closed for $0.21. Trade Machine uses end of day prices for all exits and entries and that $0.21 closing spread price exceeds the 50% limit.
That backtest tile looks like this:
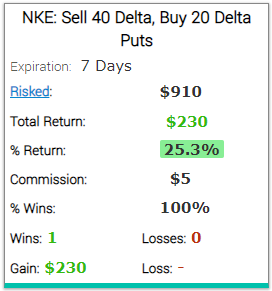
You will notice that Trade Machine measures PnL accounting for margin, so the win was 25.3%, even though the credit shrank by 60%. That's proper risk/reward attribution, which is the trademark of Trade Machine.
That's it...
Next Steps
Look for patterns. Find high win rates here. Join Trade Machine. You deserve it.Risk Disclosure
Past performance is not an indication of future results.
Trading futures and options involves the risk of loss. Please consider carefully whether futures or options are appropriate to your financial situation. Only risk capital should be used when trading futures or options. Investors could lose more than their initial investment.
Past results are not necessarily indicative of future results. The risk of loss in trading can be substantial, carefully consider the inherent risks of such an investment in light of your financial condition.
Please note that the executions and other statistics in this article are hypothetical, and do not reflect the impact, if any, of certain market factors such as liquidity and slippage.
You should read the Characteristics and Risks of Standardized Options.