NVIDIA Corp
XNAS:NVDA 4:00:00 PM EDT
212.06
+4.77
(+2.30%)
: $209.58 -2.48 (-1.17%)


NVIDIA Corporation, NVDA, earnings, trade, days, test, option, straddle, average, straddle

Disclaimer
The results here are provided for general informational purposes, as a convenience to the readers. The materials are not a substitute for obtaining professional advice from a qualified person, firm or corporation.
LEDE
It's time to tighten up with the market volatility spinning out of control. And, while this may feel risky for our stock portfolios, this is the wonderful oddity for options:
While a bull market can be fantastic with empirical testing and trend following, and it has, in fact, been rather fantastic. It turns out that a volatile market can be a remarkable opportunity, with less risk than a bull market for option traders.
This article will show that, empirically and explicitly. We are also holding a free webinar to demonstrate this idea in great detail on February 24th (Saturday) and 10am PST. To register for that free webinar, you can go here: Discover Volatile Market Trading Results -- Become a master, and leave the fear behind.
Now, let's see this crazy idea that volatility is somehow less risky for option traders.
NVIDIA Corporation (NASDAQ:NVDA) Earnings
This is a slightly advanced option trade that bets on volatility for a period that starts one-day after NVIDIA Corporation (NASDAQ:NVDA) earnings and lasts for the 4 calendar days to follow.
In NVIDIA Corporation, irrespective of whether the earnings move was large or small, if we waited one-day after earnings and then bought an one-week straddle (using weekly options), the results were quite strong. This trade opens one-day after earnings were announced to try to find a stock that moves a lot after the earnings announcement.
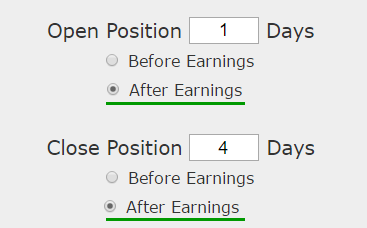
Here is the timing set-up around earnings:
Rules of this Back-test
* Open the long at-the-money straddle one-calendar day after earnings.
* Close the straddle 4 calendar days after earnings -- do not wait for the options to expire.
* Use the options closest to 7 days from expiration (but at least 7-days).
This is a straight down the middle volatility bet -- this trade wins if the stock is volatile the week following earnings and it will stand to lose if the stock is not volatile. This is not a silver bullet -- it's a trade that needs to be carefully examined.
But, this is a stock direction neutral strategy, which is to say, it wins if the stock moves up or down -- it just has to move.
RISK CONTROL
Since blindly owning volatility can be a quick way to lose in the option market, we will apply a tight risk control to this analysis as well. We will add a 40% stop loss and a 40% limit gain.
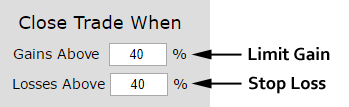
In English, at the close of every trading day, if the straddle is up 40% from the price at the start of the trade, it gets sold for a profit. If it is down 40%, it gets sold for a loss. This also has the benefit of taking profits if there is volatility early in the week rather than waiting to close 4-days later.
RESULTS
If we bought the at-the-money straddle in NVIDIA Corporation (NASDAQ:NVDA) over the last year but only held it after earnings we get these results:
Tap Here to See the Back-test
The mechanics of the TradeMachine™ are that it uses end of day prices for every back-test entry and exit (every trigger).
We see a 255.2% return, testing this over the last 4 earnings dates in NVIDIA Corporation. That's a total of just 16 days (4 days for each earnings date, over 4 earnings dates).
But the key to this strategy is not the returns in summary, but the risk to reward that is has shown in the past.
Looking at Averages
The overall return was 255%; but the trade statistics tell us more with average trade results:
➡ The average return per trade was 46.9% over 4-days.
➡ The average return per winning trade was 65.2% over 4-days.
➡ The average return for the losing trade was -8% over 4-days.
Stop. Let's re-read that.
The average win was more than 8x larger (in absolute value) than the loss. It's the loss size that we focus on here, not all the great returns for the winners. You see, back-testing non-directional trades, and then closing the positions before the options expire gives us extra hedges -- something that a bull strategy does not provide.
Hedge #1: Non-directional -- the stock can up or down (unlike a bullish bet).
Hedge #2: Close pre-expiration -- we don't let the options just fade to zero with time decay.
WHAT HAPPENED
Bull markets tend to create optimism, whether it's deserved or not. To see how to find the best performing historical momentum, technical analysis or non-directional trades for any stock using empirical results rather than guesses, we welcome you to watch this quick demonstration video:
Tap Here to See the Tools at Work
Risk Disclosure
You should read the Characteristics and Risks of Standardized Options.
Past performance is not an indication of future results.
Trading futures and options involves the risk of loss. Please consider carefully whether futures or options are appropriate to your financial situation. Only risk capital should be used when trading futures or options. Investors could lose more than their initial investment.
Past results are not necessarily indicative of future results. The risk of loss in trading can be substantial, carefully consider the inherent risks of such an investment in light of your financial condition.
Please note that the executions and other statistics in this article are hypothetical, and do not reflect the impact, if any, of certain market factors such as liquidity and slippage.
Stop. Think. The Double Hedged Volatility Trade in NVIDIA After Earnings
NVIDIA Corporation (NASDAQ:NVDA) : The Volatility Option Trade After Earnings
Date Published: 2018-02-6Author: Ophir Gottlieb
Disclaimer
The results here are provided for general informational purposes, as a convenience to the readers. The materials are not a substitute for obtaining professional advice from a qualified person, firm or corporation.
LEDE
It's time to tighten up with the market volatility spinning out of control. And, while this may feel risky for our stock portfolios, this is the wonderful oddity for options:
While a bull market can be fantastic with empirical testing and trend following, and it has, in fact, been rather fantastic. It turns out that a volatile market can be a remarkable opportunity, with less risk than a bull market for option traders.
This article will show that, empirically and explicitly. We are also holding a free webinar to demonstrate this idea in great detail on February 24th (Saturday) and 10am PST. To register for that free webinar, you can go here: Discover Volatile Market Trading Results -- Become a master, and leave the fear behind.
Now, let's see this crazy idea that volatility is somehow less risky for option traders.
NVIDIA Corporation (NASDAQ:NVDA) Earnings
This is a slightly advanced option trade that bets on volatility for a period that starts one-day after NVIDIA Corporation (NASDAQ:NVDA) earnings and lasts for the 4 calendar days to follow.
In NVIDIA Corporation, irrespective of whether the earnings move was large or small, if we waited one-day after earnings and then bought an one-week straddle (using weekly options), the results were quite strong. This trade opens one-day after earnings were announced to try to find a stock that moves a lot after the earnings announcement.
Here is the timing set-up around earnings:
Rules of this Back-test
* Open the long at-the-money straddle one-calendar day after earnings.
* Close the straddle 4 calendar days after earnings -- do not wait for the options to expire.
* Use the options closest to 7 days from expiration (but at least 7-days).
This is a straight down the middle volatility bet -- this trade wins if the stock is volatile the week following earnings and it will stand to lose if the stock is not volatile. This is not a silver bullet -- it's a trade that needs to be carefully examined.
But, this is a stock direction neutral strategy, which is to say, it wins if the stock moves up or down -- it just has to move.
RISK CONTROL
Since blindly owning volatility can be a quick way to lose in the option market, we will apply a tight risk control to this analysis as well. We will add a 40% stop loss and a 40% limit gain.
In English, at the close of every trading day, if the straddle is up 40% from the price at the start of the trade, it gets sold for a profit. If it is down 40%, it gets sold for a loss. This also has the benefit of taking profits if there is volatility early in the week rather than waiting to close 4-days later.
RESULTS
If we bought the at-the-money straddle in NVIDIA Corporation (NASDAQ:NVDA) over the last year but only held it after earnings we get these results:
| NVDA Long At-the-Money Straddle |
|||
| % Wins: | 75% | ||
| Wins: 3 | Losses: 1 | ||
| % Return: | 255% | ||
Tap Here to See the Back-test
The mechanics of the TradeMachine™ are that it uses end of day prices for every back-test entry and exit (every trigger).
Track this trade idea. Get alerted for ticker `NVDA` 1 days after earnings
We see a 255.2% return, testing this over the last 4 earnings dates in NVIDIA Corporation. That's a total of just 16 days (4 days for each earnings date, over 4 earnings dates).
But the key to this strategy is not the returns in summary, but the risk to reward that is has shown in the past.
Looking at Averages
The overall return was 255%; but the trade statistics tell us more with average trade results:
➡ The average return per trade was 46.9% over 4-days.
➡ The average return per winning trade was 65.2% over 4-days.
➡ The average return for the losing trade was -8% over 4-days.
Stop. Let's re-read that.
The average win was more than 8x larger (in absolute value) than the loss. It's the loss size that we focus on here, not all the great returns for the winners. You see, back-testing non-directional trades, and then closing the positions before the options expire gives us extra hedges -- something that a bull strategy does not provide.
Hedge #1: Non-directional -- the stock can up or down (unlike a bullish bet).
Hedge #2: Close pre-expiration -- we don't let the options just fade to zero with time decay.
WHAT HAPPENED
Bull markets tend to create optimism, whether it's deserved or not. To see how to find the best performing historical momentum, technical analysis or non-directional trades for any stock using empirical results rather than guesses, we welcome you to watch this quick demonstration video:
Tap Here to See the Tools at Work
Risk Disclosure
You should read the Characteristics and Risks of Standardized Options.
Past performance is not an indication of future results.
Trading futures and options involves the risk of loss. Please consider carefully whether futures or options are appropriate to your financial situation. Only risk capital should be used when trading futures or options. Investors could lose more than their initial investment.
Past results are not necessarily indicative of future results. The risk of loss in trading can be substantial, carefully consider the inherent risks of such an investment in light of your financial condition.
Please note that the executions and other statistics in this article are hypothetical, and do not reflect the impact, if any, of certain market factors such as liquidity and slippage.