Oracle Corp.
XNYS:ORCL
225.78
+22.08
(+10.84%)
7:59:56 PM EDT: $226.20 +0.42 (+0.19%)


Oracle Corporation, ORCL, earnings, trade, results, before

Disclaimer
The results here are provided for general informational purposes, as a convenience to the readers. The materials are not a substitute for obtaining professional advice from a qualified person, firm or corporation.
Preface
There is a bullish momentum pattern in Oracle Corporation (NYSE:ORCL) stock 5 calendar days before earnings, and we can capture that phenomenon explicitly by looking at returns in the option market.
This same strategy also worked in the throws of the bear market from 2007-2008, and we discuss those results near the finale of this article.
Oracle's next earnings release is not confirmed yet, but an estimate has it on 3-15-2018. Obviously, the actual date is required to mimic the back-test.
The Bullish Option Trade Before Earnings in Oracle Corporation
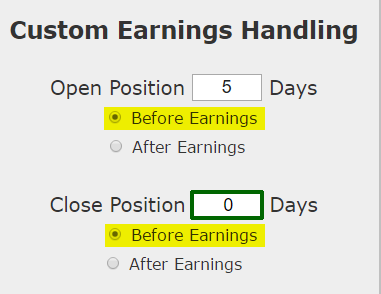
We will examine the outcome of getting long a weekly call option in Oracle Corporation 5-days before earnings (using calendar days) and selling the call before the earnings announcement.
Since Oracle reports earnings after the market closes, the back-test looks at holding the call all the way through that day and closing the trade at the market close so no earnings risk is taken. This is not an earnings trade.
Here's the set-up in great clarity; again, note that the trade closes before earnings, so this trade does not make a bet on the earnings result.
RISK MANAGEMENT
We can add another layer of risk management to the back-test by instituting and 40% stop loss and a 40% limit gain. Here is that setting:

In English, at the close of each trading day we check to see if the long option is either up or down 40% relative to the open price. If it was, the trade was closed.
RESULTS
Here are the results over the last three-years in Oracle Corporation:
Tap Here to See the Back-test
The mechanics of the TradeMachine™ are that it uses end of day prices for every back-test entry and exit (every trigger).
We see a 340.3% return, testing this over the last 12 earnings dates in Oracle Corporation. That's a total of just 72 days (6-days for each earnings date, over 12 earnings dates). This has been the results of following the trend of bullish sentiment into earnings while avoiding the actual earnings result.
Setting Expectations
One of the most interesting aspects of this back-test result can be seen in the losing trade. Check this out:
This strategy had an overall return of 340%, the trade details keep us in bounds with expectations:
➡ The average percent return per trade was 32.3% over each 6-day holding period.
➡ The average percent return per winning trade was 36.2% over each 6-day holding period.
➡ The percent return for the losing trade was -10.7% over each 6-day holding period.
Trade Discovery
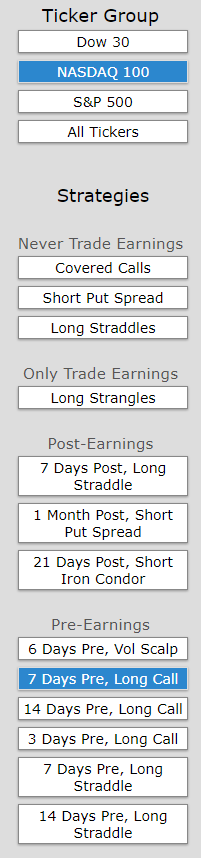
We found this back-test result by using the Trade Machine Pro™ scanner. We looked at the Nasdaq 100 and started with the "7-days Pre-earnings Long Call Back-test" and then adjusted the days before to 5 (rather than 7) and closed the trade on the day of earnings (0 days before earnings), since ORCL reports after close so there is still no earnings risk taken, to find a better historical result.
Is This Just Because Of a Bull Market?
This phenomenon of pre-earnings optimism also worked very well during 2007-2008, when the S&P 500 collapsed into the "Great Recession."
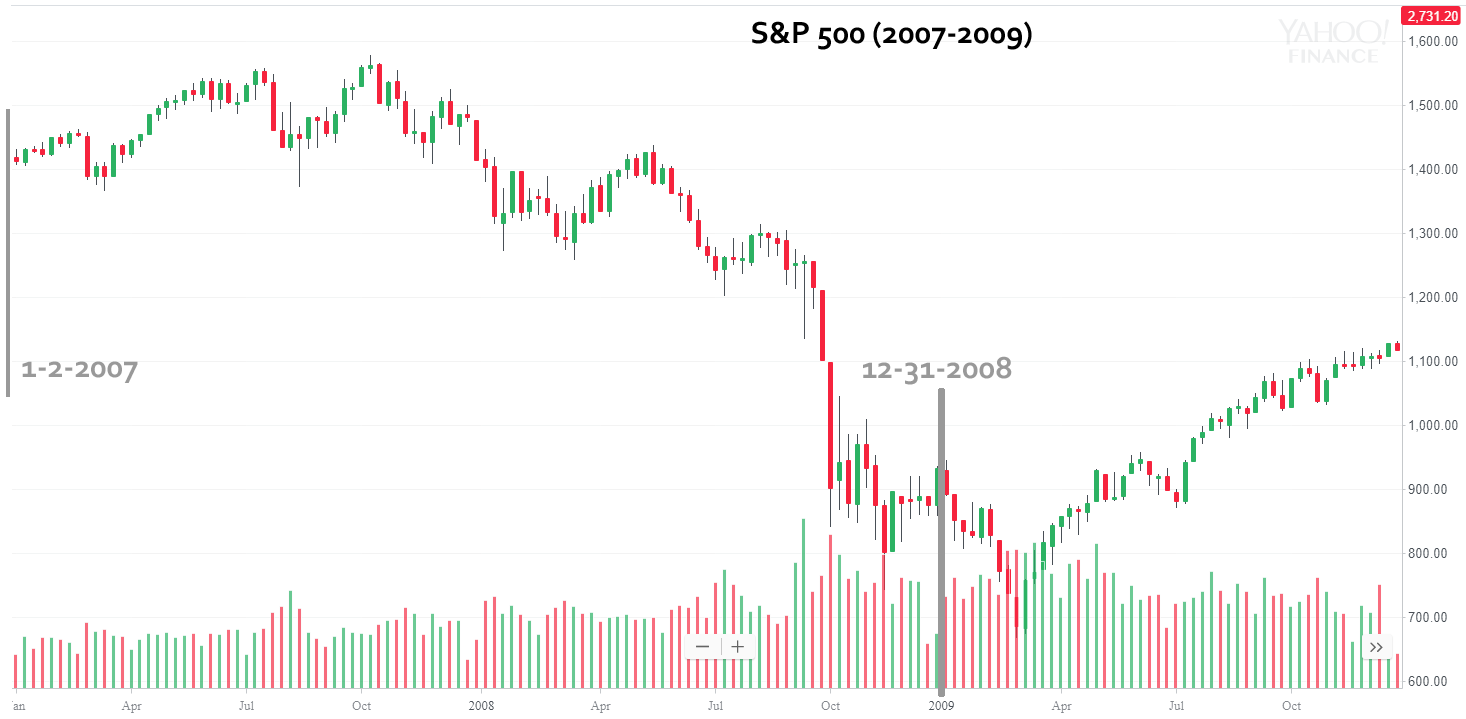
The average return for this strategy, by stock, using the constituents of the Nasdaq 100 and Dow 30 as the study group, saw a 45.3% return over those 2-years. And, of course, these are just 8 trades per stock, each lasting 7 days.
* Yes. We are empirical.
WHAT HAPPENED
Bull markets tend to create optimism, whether it's deserved or not. To see how to find the best performing historical momentum, technical analysis or non-directional trades for any stock using empirical results rather than guesses, we welcome you to watch this quick demonstration video:
Tap Here to See the Tools at Work
Risk Disclosure
You should read the Characteristics and Risks of Standardized Options.
Past performance is not an indication of future results.
Trading futures and options involves the risk of loss. Please consider carefully whether futures or options are appropriate to your financial situation. Only risk capital should be used when trading futures or options. Investors could lose more than their initial investment.
Past results are not necessarily indicative of future results. The risk of loss in trading can be substantial, carefully consider the inherent risks of such an investment in light of your financial condition.
Please note that the executions and other statistics in this article are hypothetical, and do not reflect the impact, if any, of certain market factors such as liquidity and slippage.
Massive Bullish Momentum Comes in Short Bursts Right Before Earnings in Oracle Corporation
Oracle Corporation (NYSE:ORCL): Massive Bullish Momentum Comes in Short Bursts Right Before Earnings
Date Published: 2018-03-4Author: Ophir Gottlieb
Disclaimer
The results here are provided for general informational purposes, as a convenience to the readers. The materials are not a substitute for obtaining professional advice from a qualified person, firm or corporation.
Preface
There is a bullish momentum pattern in Oracle Corporation (NYSE:ORCL) stock 5 calendar days before earnings, and we can capture that phenomenon explicitly by looking at returns in the option market.
This same strategy also worked in the throws of the bear market from 2007-2008, and we discuss those results near the finale of this article.
Oracle's next earnings release is not confirmed yet, but an estimate has it on 3-15-2018. Obviously, the actual date is required to mimic the back-test.
The Bullish Option Trade Before Earnings in Oracle Corporation
We will examine the outcome of getting long a weekly call option in Oracle Corporation 5-days before earnings (using calendar days) and selling the call before the earnings announcement.
Since Oracle reports earnings after the market closes, the back-test looks at holding the call all the way through that day and closing the trade at the market close so no earnings risk is taken. This is not an earnings trade.
Here's the set-up in great clarity; again, note that the trade closes before earnings, so this trade does not make a bet on the earnings result.
RISK MANAGEMENT
We can add another layer of risk management to the back-test by instituting and 40% stop loss and a 40% limit gain. Here is that setting:
In English, at the close of each trading day we check to see if the long option is either up or down 40% relative to the open price. If it was, the trade was closed.
RESULTS
Here are the results over the last three-years in Oracle Corporation:
| ORCL: Long 40 Delta Call | |||
| % Wins: | 91.7% | ||
| Wins: 11 | Losses: 1 | ||
| % Return: | 340% | ||
Tap Here to See the Back-test
The mechanics of the TradeMachine™ are that it uses end of day prices for every back-test entry and exit (every trigger).
We see a 340.3% return, testing this over the last 12 earnings dates in Oracle Corporation. That's a total of just 72 days (6-days for each earnings date, over 12 earnings dates). This has been the results of following the trend of bullish sentiment into earnings while avoiding the actual earnings result.
Track this trade idea. Get alerted for ticker `ORCL` 5 days before earnings
Setting Expectations
One of the most interesting aspects of this back-test result can be seen in the losing trade. Check this out:
This strategy had an overall return of 340%, the trade details keep us in bounds with expectations:
➡ The average percent return per trade was 32.3% over each 6-day holding period.
➡ The average percent return per winning trade was 36.2% over each 6-day holding period.
➡ The percent return for the losing trade was -10.7% over each 6-day holding period.
Trade Discovery
We found this back-test result by using the Trade Machine Pro™ scanner. We looked at the Nasdaq 100 and started with the "7-days Pre-earnings Long Call Back-test" and then adjusted the days before to 5 (rather than 7) and closed the trade on the day of earnings (0 days before earnings), since ORCL reports after close so there is still no earnings risk taken, to find a better historical result.
Is This Just Because Of a Bull Market?
This phenomenon of pre-earnings optimism also worked very well during 2007-2008, when the S&P 500 collapsed into the "Great Recession."
The average return for this strategy, by stock, using the constituents of the Nasdaq 100 and Dow 30 as the study group, saw a 45.3% return over those 2-years. And, of course, these are just 8 trades per stock, each lasting 7 days.
* Yes. We are empirical.
WHAT HAPPENED
Bull markets tend to create optimism, whether it's deserved or not. To see how to find the best performing historical momentum, technical analysis or non-directional trades for any stock using empirical results rather than guesses, we welcome you to watch this quick demonstration video:
Tap Here to See the Tools at Work
Risk Disclosure
You should read the Characteristics and Risks of Standardized Options.
Past performance is not an indication of future results.
Trading futures and options involves the risk of loss. Please consider carefully whether futures or options are appropriate to your financial situation. Only risk capital should be used when trading futures or options. Investors could lose more than their initial investment.
Past results are not necessarily indicative of future results. The risk of loss in trading can be substantial, carefully consider the inherent risks of such an investment in light of your financial condition.
Please note that the executions and other statistics in this article are hypothetical, and do not reflect the impact, if any, of certain market factors such as liquidity and slippage.