Palo Alto Networks Inc
XNAS:PANW 11:54:26 AM EDT
272.66
+9.44
(+3.59%)


Palo Alto Networks Inc, PANW, earnings, return, short-term, trade

Disclaimer
The results here are provided for general informational purposes, as a convenience to the readers. The materials are not a substitute for obtaining professional advice from a qualified person, firm or corporation.
Preface
The bull isn't dead, but much to the surprise of many, neither is volatility (any more). We have looked at empirical results for strategies that benefit from volatility, most recently focusing on GOOGL, NVDA, and EXPE.
While a bull market can be fantastic with empirical testing and trend following, a volatile market, too, can be a remarkable opportunity, with less risk than a bull market for option traders. We will demonstrate this empirically and explicitly during a free webinar on February 24th (Saturday).
To register for that free webinar, you can go here: Discover Volatile Market Trading Results -- An Once in a Generation Phenomenon.
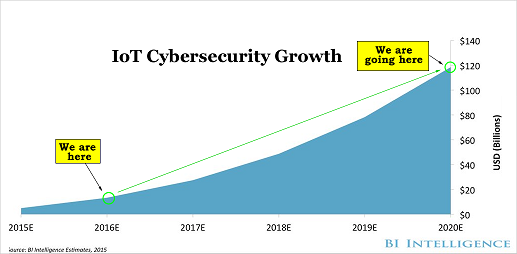
But today, we turn back to the bull, and the undeniable repeating pattern of bullishness ahead of earnings in tech stocks. This time, cyber security wunderkind Palo Alto Networks Inc (NYSE:PANW) is in our sights. Just the IoT segment is growing from $20 billion to $120 billion in five years. In total cyber security is seen reaching $170 billion by 2020.
We will focus on a very tight window of time, to flush out some of the risk in the market, trying to hone in on this pattern on its own, without market noise.
According to our earnings date provider, Wall Street Horizon, Palo Alto Networks next has earnings due on 2-26-2018 (a Monday), after the market closes. 3 trading days days before then would be 2-21-2018 (at the market close). IDEA
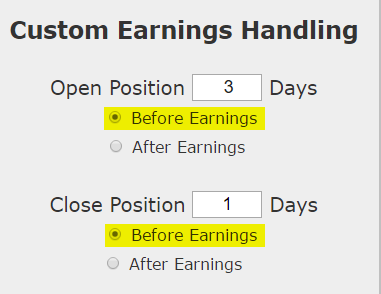
We will examine the outcome of going long a weekly call option in Palo Alto Networks Inc just three trading days before earnings and selling the call one day before the actual news.
This is construct of the trade, noting that the short-term trade closes before earnings and therefore does not take a position on the earnings result.
RISK MANAGEMENT
We can add another layer of risk management to the back-test by instituting and 40% stop loss and a 40% limit gain. Here is that setting:
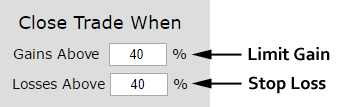
In English, at the close of each trading day we check to see if the long option is either up or down 40% relative to the open price. If it was, the trade was closed.
DISCOVERY
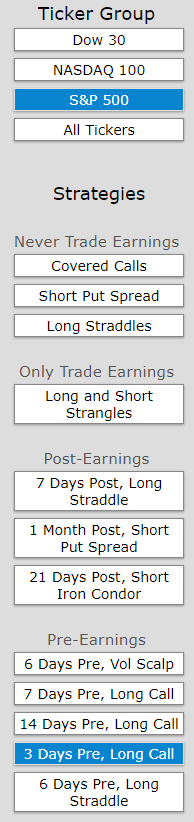
As always, we discovered this back-test using the Trade Machine® Pro scanner, looking at the S&P 500 and scanning for the "3-days pre-earnings long call."
RESULTS
Below we present the back-test stats over the last two-years in Palo Alto Networks Inc:
Tap Here to See the Back-test
The mechanics of the TradeMachine™ are that it uses end of day prices for every back-test entry and exit (every trigger).
We see a 127% return, testing this over the last 8 earnings dates in Palo Alto Networks Inc. That's a total of just 24 days (3-day holding period for each earnings date, over 8 earnings dates).
The trade will lose sometimes, and since it is such a short-term position, it can lose from news that moves the whole market that has nothing to do with Palo Alto Networks Inc, but over the recent history, this bullish option trade has won ahead of earnings.
Setting Expectations
While this strategy has an overall return of 127%, the trade details keep us in bounds with expectations:
➡ The average percent return per trade was 19.1% over 3-days.
➡ The average percent return per winning trade was 24.6% over 3-days.
➡ The average percent return for the losing trade was -19.8% over 3-days.
Looking at More Recent History
We did a multi-year back-test above, now we can look at just the last year:
Tap Here to See the Back-test
We're now looking at 161.2% returns, on 4 winning trades and 0 losing trades.
➡ The average percent return over the last year per trade was 36.6%.
WHAT HAPPENED
Bull markets tend to create optimism, whether it's deserved or not. To see how to find the best performing historical momentum, technical analysis or non-directional trades for any stock using empirical results rather than guesses, we welcome you to watch this quick demonstration video:
Tap Here to See the Tools at Work
Risk Disclosure
You should read the Characteristics and Risks of Standardized Options.
Past performance is not an indication of future results.
Trading futures and options involves the risk of loss. Please consider carefully whether futures or options are appropriate to your financial situation. Only risk capital should be used when trading futures or options. Investors could lose more than their initial investment.
Past results are not necessarily indicative of future results. The risk of loss in trading can be substantial, carefully consider the inherent risks of such an investment in light of your financial condition.
Please note that the executions and other statistics in this article are hypothetical, and do not reflect the impact, if any, of certain market factors such as liquidity and slippage.
Swing Trade Pre-Earnings Momentum in Palo Alto Networks
Palo Alto Networks Inc (NYSE:PANW) : Swing Trade Earnings Bullish Momentum With Options
Date Published: 2018-02-11Author: Ophir Gottlieb
Disclaimer
The results here are provided for general informational purposes, as a convenience to the readers. The materials are not a substitute for obtaining professional advice from a qualified person, firm or corporation.
Preface
The bull isn't dead, but much to the surprise of many, neither is volatility (any more). We have looked at empirical results for strategies that benefit from volatility, most recently focusing on GOOGL, NVDA, and EXPE.
While a bull market can be fantastic with empirical testing and trend following, a volatile market, too, can be a remarkable opportunity, with less risk than a bull market for option traders. We will demonstrate this empirically and explicitly during a free webinar on February 24th (Saturday).
To register for that free webinar, you can go here: Discover Volatile Market Trading Results -- An Once in a Generation Phenomenon.
But today, we turn back to the bull, and the undeniable repeating pattern of bullishness ahead of earnings in tech stocks. This time, cyber security wunderkind Palo Alto Networks Inc (NYSE:PANW) is in our sights. Just the IoT segment is growing from $20 billion to $120 billion in five years. In total cyber security is seen reaching $170 billion by 2020.
We will focus on a very tight window of time, to flush out some of the risk in the market, trying to hone in on this pattern on its own, without market noise.
According to our earnings date provider, Wall Street Horizon, Palo Alto Networks next has earnings due on 2-26-2018 (a Monday), after the market closes. 3 trading days days before then would be 2-21-2018 (at the market close). IDEA
We will examine the outcome of going long a weekly call option in Palo Alto Networks Inc just three trading days before earnings and selling the call one day before the actual news.
This is construct of the trade, noting that the short-term trade closes before earnings and therefore does not take a position on the earnings result.
RISK MANAGEMENT
We can add another layer of risk management to the back-test by instituting and 40% stop loss and a 40% limit gain. Here is that setting:
In English, at the close of each trading day we check to see if the long option is either up or down 40% relative to the open price. If it was, the trade was closed.
DISCOVERY
As always, we discovered this back-test using the Trade Machine® Pro scanner, looking at the S&P 500 and scanning for the "3-days pre-earnings long call."
RESULTS
Below we present the back-test stats over the last two-years in Palo Alto Networks Inc:
| PANW: Long 40 Delta Call | |||
| % Wins: | 87.5% | ||
| Wins: 7 | Losses: 1 | ||
| % Return: | 127% | ||
Tap Here to See the Back-test
The mechanics of the TradeMachine™ are that it uses end of day prices for every back-test entry and exit (every trigger).
Track this trade idea. Get alerted for ticker `PANW` 3 days before earnings
We see a 127% return, testing this over the last 8 earnings dates in Palo Alto Networks Inc. That's a total of just 24 days (3-day holding period for each earnings date, over 8 earnings dates).
The trade will lose sometimes, and since it is such a short-term position, it can lose from news that moves the whole market that has nothing to do with Palo Alto Networks Inc, but over the recent history, this bullish option trade has won ahead of earnings.
Setting Expectations
While this strategy has an overall return of 127%, the trade details keep us in bounds with expectations:
➡ The average percent return per trade was 19.1% over 3-days.
➡ The average percent return per winning trade was 24.6% over 3-days.
➡ The average percent return for the losing trade was -19.8% over 3-days.
Looking at More Recent History
We did a multi-year back-test above, now we can look at just the last year:
| PANW: Long 40 Delta Call | |||
| % Wins: | 100% | ||
| Wins: 4 | Losses: 0 | ||
| % Return: | 161.2% | ||
| % Annualized: | 7,355% | ||
Tap Here to See the Back-test
We're now looking at 161.2% returns, on 4 winning trades and 0 losing trades.
➡ The average percent return over the last year per trade was 36.6%.
WHAT HAPPENED
Bull markets tend to create optimism, whether it's deserved or not. To see how to find the best performing historical momentum, technical analysis or non-directional trades for any stock using empirical results rather than guesses, we welcome you to watch this quick demonstration video:
Tap Here to See the Tools at Work
Risk Disclosure
You should read the Characteristics and Risks of Standardized Options.
Past performance is not an indication of future results.
Trading futures and options involves the risk of loss. Please consider carefully whether futures or options are appropriate to your financial situation. Only risk capital should be used when trading futures or options. Investors could lose more than their initial investment.
Past results are not necessarily indicative of future results. The risk of loss in trading can be substantial, carefully consider the inherent risks of such an investment in light of your financial condition.
Please note that the executions and other statistics in this article are hypothetical, and do not reflect the impact, if any, of certain market factors such as liquidity and slippage.