Global X Funds - Global X Defense Tech ETF


Why Sears Holdings May Be Dying
Fundamentals Technicals | Support: 24.78 | Resistance: 29.23 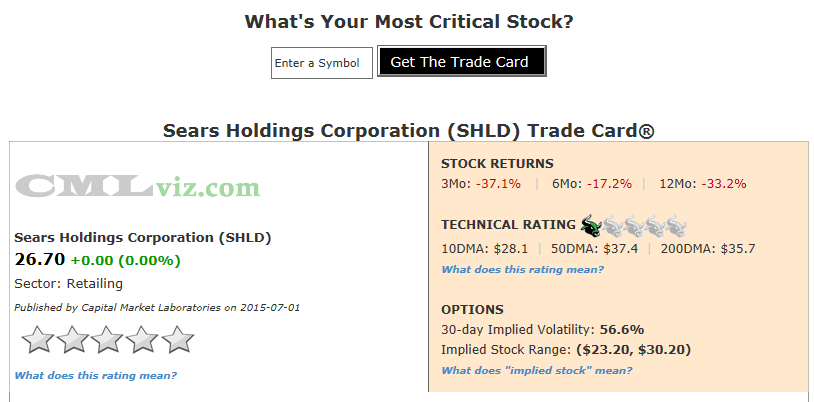
Sears Holdings has been collapsing both fundamentally and in its stock price for nearly a decade. Some feel it may have started when the firm bought K-Mart back in 2005. The company has been selling assets, closing stores and throttled capital expenditures just to stay in business. The Motley Fool reports that John Kernan of Cowen sees SHLD closing 500 stores in the next few years out of a total of under 2,000.
The spiral began as the firm simply did not move fast enough in the Internet space, while Amazon (AMZN) stepped in, and both Wal-Mart (WMT) and Target (TGT) have re-vamped, re-modelled and re-invested in technology to stay relevant. Sears has done none of that. Sears also needs cash and is likely to sell its last massive asset, which is Sears Canada (it owns 51%).
SHLD's revenue (TTM) has dropped for more than five consecutive quarters. One year ago the firm reported $35.6 billion while the most recent trailing-twelve-months yielded just $29.2 billion in revenue (an 18% drop year-over-year). That number dives to a 25% two-year drop.![]()
SHLD has a one bull (lowest rated) technical rating because it's trading below the 10-day (short-term), 50-day (medium-term) and 200-day (long-term) moving averages.
Here are the consensus estimates for next quarter. Note that last quarter's actual result is included at the far right.
| EARNINGS ESTIMATES | |||||
| Earnings Date | EPS | Revenue (Mean) | Revenue (Median) | Last Quarter (Actual) | |
| 2015-08-20 | $-3.21 | $6,093.5 M | $6,093.5 M | $5,882.0 M | Provided by ZACKS |
Let's look at the core elements that drive the company's fundamental rating.
|
|
|
Fundamentals Rating Summary |
|
|
| METRIC | CURRENT | 1YR AGO | 2YR AGO | DIRECTION |
| Revenue (TTM US$ Millions) | 29,201 | 35,615 | 39,036 |  |
| Operating Margin (QTR) | 0.960 | 0.95 | 0.97 | RISING |
| Net Income (TTM US$ Millions) | -1,583 | -1,488 | -1,398 | FALLING |
| Levered Free Cash Flow (TTM US$ Millions) | -235 | 299 | -593 | FALLING |
| Capital Expenditures (TTM US$ Millions) | 242 | 341 | 358 | FALLING |

|
|
| Stock Returns and Chart |
|
|
Before we dig into the fundamental trends that drive the rating, let's look at a two-year stock chart with regression channel and 10-day momentum (on the bottom).

Click here to interact with this stock chart
Now let's examine the visualizations of the critical financial measures.

| METRIC | CURRENT | 1YR AGO | 2YR AGO | DIRECTION |
| Revenue (TTM US$ Millions) | 29,201 | 35,615 | 39,036 | |
Revenue (TTM) is trending lower meaning that it has decreased for at least five consecutive quarters (in this case, nearly 20 consecutive quarters). We can see the trend rather clearly in the time series chart, below. At its peak, the firm hit over $53 billion in sales in 2006.
What do all these numbers mean?
SHLD's fundamental rating was hit hard by these results:
1. The one-year change was negative.
2. The two-year change was negative.
Finally, the five+ consecutive quarters of a down trend in revenue hurt the fundamental (star) rating..
Let's look at Revenue (TTM US$ Millions) in the chart below.

Click Here to Interact With This Chart
| METRIC | CURRENT | 1YR AGO | 2YR AGO | DIRECTION |
| Net Income (TTM US$ Millions) | -1,583 | -1,488 | -1,398 | FALLING |
Net Income (after tax profit) over the trailing twelve months (TTM) for SHLD is falling. For the most recent trailing-twelve-months (TTM) the company reported a loss of -1.6 billion. The company last reported a profit in 2011.
In our next chart we plot Net Income (TTM US$ Millions) in the blue bars.

Click Here to Interact With This Chart
| METRIC | CURRENT | 1YR AGO | 2YR AGO | DIRECTION |
| Levered Free Cash Flow (TTM US$ Millions) | -235 | 299 | -593 | FALLING |
Levered Free Cash Flow (TTM US$ Millions) is a critical determinant of stock price since market cap is the present value of all future free cash flows. For SHLD the metric is falling (it was $299 million last year). For the most recent trailing-twelve-months the company reported FCF (TTM) of -$235 million. At its peak, SHLD reported $3.5 billion in FCF (TTM) back in 2006.
For our next chart we plot Levered Free Cash Flow (TTM US$ Millions) in the blue bars through time.

Click Here to Interact With This Chart
| METRIC | CURRENT | 1YR AGO | 2YR AGO | DIRECTION |
| Capital Expenditures (TTM US$ Millions) | 242 | 341 | 358 | FALLING |
Oddly, the real death nail may be Capital Expenditures (CapEx) (TTM US$ Millions). Spending come down 29% year-over-year and is down ~60% from its peak free cash flow days in 2006. Further, we can see that CapEx today relative to two-years ago is down 32%. "Innovate or die" has long been the mantra of Silicon Valley and in reality, is the mantra of all businesses. SHLD isn't innovating, which leaves one alternative.
In our final time series chart we plot Capital Expenditures (TTM US$ Millions) in the blue bars. Note the falling bars from one-year ago.

Click Here to Interact With This Chart
Summary
With revenue collapsing, net income now at a $1.6 billion loss and FCF falling negative, SHLD is one of few companies in the world with a zero star rating. Further, its cash ratio (total cash and cash equivalents to its current liabilities) is lower than all peers. In fact, let's look at all retailing companies with revenue above $20 billion, rank them on the x-axis (equal spaced) and plot the cash ratio on the y-axis.

Click To Interact With This Image
We can SHLD all by itself.
SHLD's assets are also at 13-year lows. All told, the company is suffocating on every aspect of the business landscape from internal investment, to cash, to revenue and earnings and even return on asets which has dropped to a negative 13%. Nothing is set in stone, but all signs point to one disappointing conclusion. Sears Holdings is going to die.