SPDR S&P 500, SPY, ETF, options, volatility, iron condor

LEDE
This is a slightly advanced option trade that looks to sell volatility in SPDR S&P 500 (NYSEARCA:SPY) using an iron condor strategy that has been a winner for the last 2 years.
While we have spent much of our time focusing on pre- and post-earnings patterns in stocks, often times with directional biases, but today we look at a different type of trade with a different type of security -- one that will add a wonderful diversification to our back-tests. We are soon adding this scan to the TradeMachine® Pro Scanner, and today we talk about the most traded ETF in the world as a starting point.
SPDR S&P 500 (NYSEARCA:SPY) ETFs
ETFs (exchange traded funds) pose an interesting security for option traders in that there are no earnings dates, like normal stocks, there are no "takeovers or buyouts," and many of the other unusual and unexpected events that can haunt a normal stock are either non-existent or limited relative to stocks.
For SPDR S&P 500, selling an out of the money iron condor (using monthly options) has shown quite strong results. This trade opens every month and repeats itself.
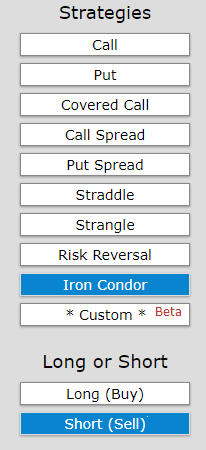
We can test this approach without bias with a short iron condor. Here is the set-up:

Rules
* Open the short iron condor every 30 days.
* Use the options closest to 30 days from expiration.
And a note before we see the results: This is a straight down the middle volatility bet -- this trade wins if the ETF is not volatile and it will stand to lose if the ETF is volatile.
RISK MANAGEMENT
We can add another layer of risk management to the back-test by instituting and 40% stop loss and a 40% limit gain. Here is that setting:

In English, at the close of each trading day we check to see if the total position is either up or down 40% relative to the open price. If it was, the trade was closed.
RESULTS
If we sold this 30/10 delta iron condor in SPDR S&P 500 (NYSEARCA:SPY) over the last two-years we get these results:
Tap Here to See the Back-test
We see a 205% return, testing this over the last 2 years.
We can also see that this strategy hasn't been a winner all the time, rather it has won 23 times and lost 3 times, for a 88% win-rate.
Setting Expectations
While this strategy had an overall return of 205%, the trade details keep us in bounds with expectations:
➡ The average percent return per trade was 11.43% over 30-days.
➡ The average percent return per winning trade was 14.72% over 30-days.
➡ The average percent return per losing trade was -13.74% over 30-days.
When This Will Not Work
We have spent time on discussing this back-test and when it will show positive results -- but there is a discussion to be had about when it will not show good results. This back-test will suffer losses if the underlying security, in this case SPY, moves with a lot of volatility and breaks out of a trading range.
Over the Last Year
We can also examine this back-test over the last year -- that is, the same short iron condor every month over the last twelve-months. Here are those results:
Tap Here to See the Back-test
We see a 84.4% return, testing this over the last year.
EXAMPLE OF THIS TRADE
While working with delta is a wonderful way to analyze options, let's just see one actual back-tested trade, by strike, in this series:

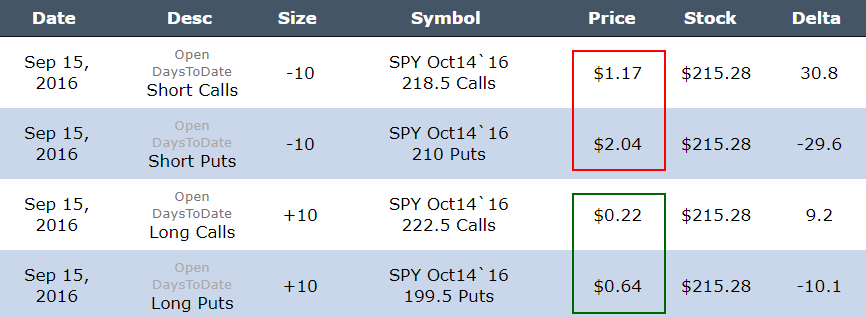
With SPY priced at $215.28 the back-tested trade from Sep 15th, 2016 was:
* Sell 218.5 delta call @ $1.17
* Sell 210 delta put @ $2.04
* Buy 222.5 delta call for $0.22
* Buy 199.5 delta put for $0.64
The total credit for placing the trade was $1.17 + $2.04 - $0.22 - $0.64 = $2.35
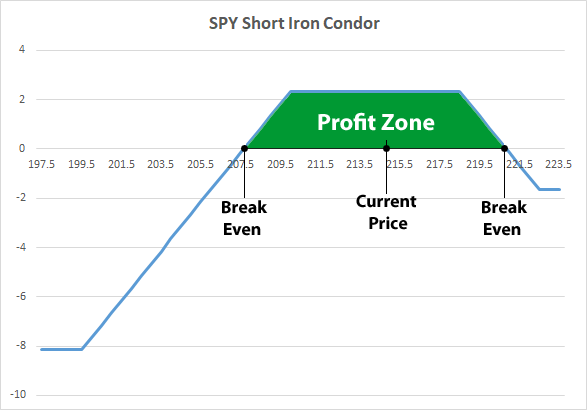
Here is the how the profit and loss looks by stock price for this one trade:

The trade suffers losses below $206.5 (ish) and above $220.5 (ish). Everything in between that zone is a profit, with the price of SPY at the time of the trade at $215.28.
This should make it explicit what type of movement in the underlying ETF this strategy is looking to benefit from -- small moves in the underlying for the month of the trade.
WHAT HAPPENED
This is it -- this is how people profit from the option market -- it's preparation, not luck.
To see how to do this for any stock or ETF we welcome you to watch this quick demonstration video:
Tap Here to See the Tools at Work
Thanks for reading.
Risk Disclosure
You should read the Characteristics and Risks of Standardized Options.
Past performance is not an indication of future results.
Trading futures and options involves the risk of loss. Please consider carefully whether futures or options are appropriate to your financial situation. Only risk capital should be used when trading futures or options. Investors could lose more than their initial investment.
Past results are not necessarily indicative of future results. The risk of loss in trading can be substantial, carefully consider the inherent risks of such an investment in light of your financial condition.
The ETF Volatility Option Trade in SPDR S&P 500 (NYSEARCA:SPY)

SPDR S&P 500 (NYSEARCA:SPY): The ETF Volatility Option Trade
Date Published: 2017-09-15Author: Ophir Gottlieb
LEDE
This is a slightly advanced option trade that looks to sell volatility in SPDR S&P 500 (NYSEARCA:SPY) using an iron condor strategy that has been a winner for the last 2 years.
While we have spent much of our time focusing on pre- and post-earnings patterns in stocks, often times with directional biases, but today we look at a different type of trade with a different type of security -- one that will add a wonderful diversification to our back-tests. We are soon adding this scan to the TradeMachine® Pro Scanner, and today we talk about the most traded ETF in the world as a starting point.
SPDR S&P 500 (NYSEARCA:SPY) ETFs
ETFs (exchange traded funds) pose an interesting security for option traders in that there are no earnings dates, like normal stocks, there are no "takeovers or buyouts," and many of the other unusual and unexpected events that can haunt a normal stock are either non-existent or limited relative to stocks.
For SPDR S&P 500, selling an out of the money iron condor (using monthly options) has shown quite strong results. This trade opens every month and repeats itself.
We can test this approach without bias with a short iron condor. Here is the set-up:

Rules
* Open the short iron condor every 30 days.
* Use the options closest to 30 days from expiration.
And a note before we see the results: This is a straight down the middle volatility bet -- this trade wins if the ETF is not volatile and it will stand to lose if the ETF is volatile.
RISK MANAGEMENT
We can add another layer of risk management to the back-test by instituting and 40% stop loss and a 40% limit gain. Here is that setting:

In English, at the close of each trading day we check to see if the total position is either up or down 40% relative to the open price. If it was, the trade was closed.
RESULTS
If we sold this 30/10 delta iron condor in SPDR S&P 500 (NYSEARCA:SPY) over the last two-years we get these results:
| SPY: Short 30 Delta / 10 Delta Iron Condor |
|||
| % Wins: | 88% | ||
| Wins: 23 | Losses: 3 | ||
| % Return: | 205% | ||
Tap Here to See the Back-test
We see a 205% return, testing this over the last 2 years.
We can also see that this strategy hasn't been a winner all the time, rather it has won 23 times and lost 3 times, for a 88% win-rate.
Setting Expectations
While this strategy had an overall return of 205%, the trade details keep us in bounds with expectations:
➡ The average percent return per trade was 11.43% over 30-days.
➡ The average percent return per winning trade was 14.72% over 30-days.
➡ The average percent return per losing trade was -13.74% over 30-days.
When This Will Not Work
We have spent time on discussing this back-test and when it will show positive results -- but there is a discussion to be had about when it will not show good results. This back-test will suffer losses if the underlying security, in this case SPY, moves with a lot of volatility and breaks out of a trading range.
Over the Last Year
We can also examine this back-test over the last year -- that is, the same short iron condor every month over the last twelve-months. Here are those results:
| SPY: Short 30 Delta / 10 Delta Iron Condor |
|||
| % Wins: | 85% | ||
| Wins: 11 | Losses: 2 | ||
| % Return: | 84.4% | ||
Tap Here to See the Back-test
We see a 84.4% return, testing this over the last year.
EXAMPLE OF THIS TRADE
While working with delta is a wonderful way to analyze options, let's just see one actual back-tested trade, by strike, in this series:

With SPY priced at $215.28 the back-tested trade from Sep 15th, 2016 was:
* Sell 218.5 delta call @ $1.17
* Sell 210 delta put @ $2.04
* Buy 222.5 delta call for $0.22
* Buy 199.5 delta put for $0.64
The total credit for placing the trade was $1.17 + $2.04 - $0.22 - $0.64 = $2.35
Here is the how the profit and loss looks by stock price for this one trade:

The trade suffers losses below $206.5 (ish) and above $220.5 (ish). Everything in between that zone is a profit, with the price of SPY at the time of the trade at $215.28.
This should make it explicit what type of movement in the underlying ETF this strategy is looking to benefit from -- small moves in the underlying for the month of the trade.
WHAT HAPPENED
This is it -- this is how people profit from the option market -- it's preparation, not luck.
To see how to do this for any stock or ETF we welcome you to watch this quick demonstration video:
Tap Here to See the Tools at Work
Thanks for reading.
Risk Disclosure
You should read the Characteristics and Risks of Standardized Options.
Past performance is not an indication of future results.
Trading futures and options involves the risk of loss. Please consider carefully whether futures or options are appropriate to your financial situation. Only risk capital should be used when trading futures or options. Investors could lose more than their initial investment.
Past results are not necessarily indicative of future results. The risk of loss in trading can be substantial, carefully consider the inherent risks of such an investment in light of your financial condition.


