


It Can Only Be Ignored for So Long: Trading S&P 500 Options, That Has Won in All Markets

It Can Only Be Ignored for So Long: Trading S&P 500 Options, That Has Won in All Markets
Date Published: 2018-10-20
Disclaimer
The results here are provided for general informational purposes, as a convenience to the readers. The materials are not a substitute for obtaining professional advice from a qualified person, firm or corporation.LEDE
Some may balk at the idea of a multi-legged option strategies -- too complex, too many trades, not my style. It isn't any of those things -- and in the S&P 500, there's only so long the results can be ignored when the market hits a volatility zone -- or when it doesn't.Building the Strategy Before We See the Results
We constructed a multi-leg strategy for the S&P 500 ETF, SPY. It has a bearish tilt, more so than any other ratio spreads we have back-tested, but it does turn a profit in a bull market as well.This one is slightly different than the prior ratio spreads -- it's a little more bearish.
Here is the image of the strategy.
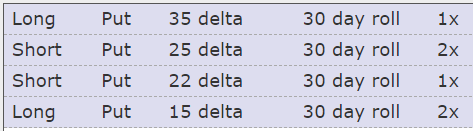
As usual, rather than take this is one big trade, we can actually break it into two familiar trades. This could be one way to apply this lesson in real life. That is, open 2 put spreads.
Rules
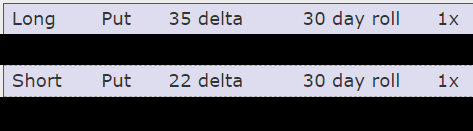
The first leg is simply long one put spread:* Long one 35/22 delta monthly put spread.
This is long one put spread
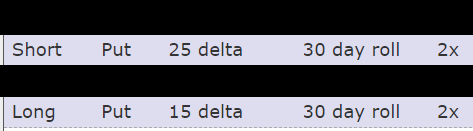
The second leg is simply short two put spreads:
* Short two 25/15 delta monthly put spreads.
This is short two put spreads
What Does This Mean?
This is casually called a ratio put spread, and specifically this is a 1 x 2 x 1 x 2 (read out loud as "1 by 2 by 1 by 2") put spread.The idea is to create an option position that:
* Creates a credit at onset.
* Has no upside risk (a stock rise to any price should be profitable).
* Has some downside bias (if the stock goes down it profits at the maximum level)
* Has a hard limit on total downside.
Broadly speaking, this is how all of that looks in a profit and loss chart at expiration:
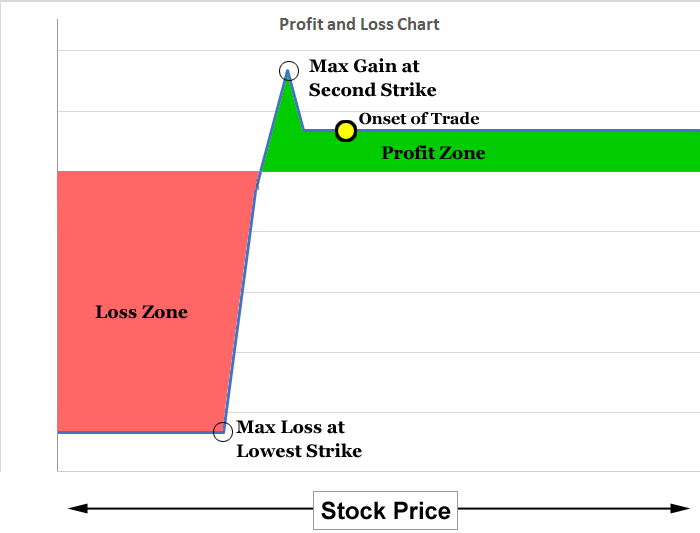
This strategy is profitable in the green shaded area, and shows a loss in the red shaded area.
To get your bearings:
* The maximum loss starts at the lowest strike price. Any stock price there or lower shows a capped loss at its maximum.
* The maximum gain occurred right at the second-strike price (the first short strike price), which is below the initial stock price at onset of the trade.
This strategy does well in a bull market but does best in a bear market. It does worst when there is a very large stock drop, but that loss is capped.
Finally, The Results
Here are the results of this strategy over the last five-years.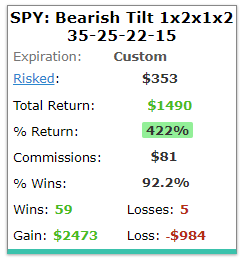
The Bear Market
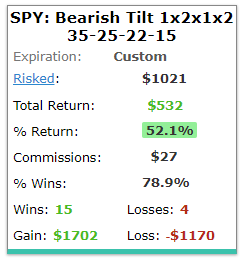
But here's the part that really caught our eye. We can test this strategy during the throes of the bear market -- the worst of the worst in the last decade.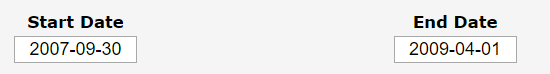
And here are those results:
How to Try This Yourself
We simply used the Trade Machine® Custom Strategy builder. You can create it yourself immediately as a Trade Machine member, by simply clicking on any of the back-test links above, then click the "edit" button, and save.What Happened
Win. Tap the link below to become your own option expert.Tap Here to Learn More
Risk Disclosure
You should read the Characteristics and Risks of Standardized Options.
Past performance is not an indication of future results.
Trading futures and options involves the risk of loss. Please consider carefully whether futures or options are appropriate to your financial situation. Only risk capital should be used when trading futures or options. Investors could lose more than their initial investment.
Past results are not necessarily indicative of future results. The risk of loss in trading can be substantial, carefully consider the inherent risks of such an investment in light of your financial condition.
Please note that the executions and other statistics in this article are hypothetical, and do not reflect the impact, if any, of certain market factors such as liquidity and slippage.