Block Inc - Ordinary Shares - Class A
:SQ 4:00:00 PM EDT
77.46
-2.92
(-3.63%)
: $76.70 -0.76 (-0.98%)


Square Inc, SQ, earnings, return, before, trade, option, optimism

Disclaimer
The results here are provided for general informational purposes, as a convenience to the readers. The materials are not a substitute for obtaining professional advice from a qualified person, firm or corporation.
Preface
It doesn't get a lot of attention, but payment service provider and processor, Square Inc (NYSE:SQ), has been on a tear over the last two-years, up more than 300%.
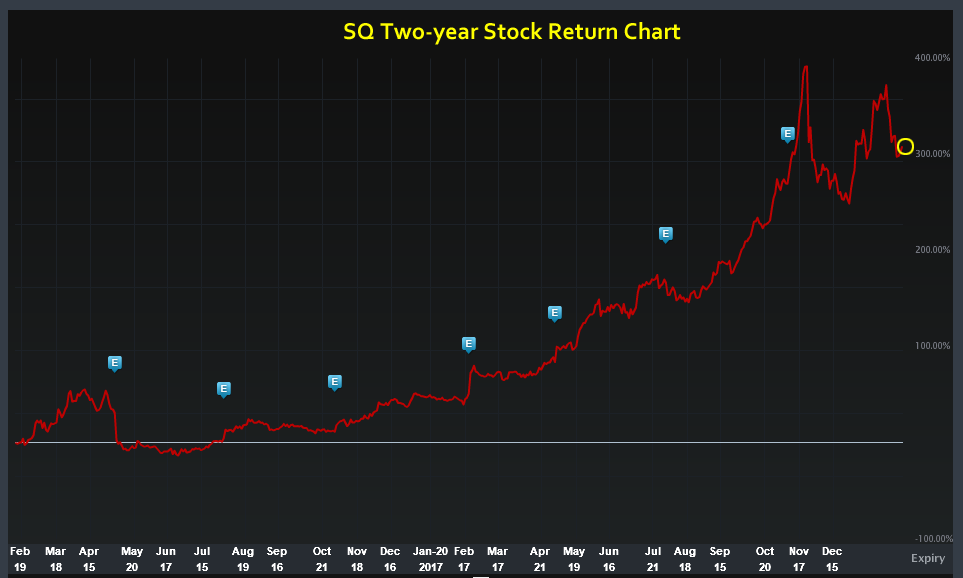
Within that run, has been a pre-earnings momentum pattern, but this one is a little different than the others we follow and that difference makes in an interesting topic given the recent massive market volatility.
PREMISE
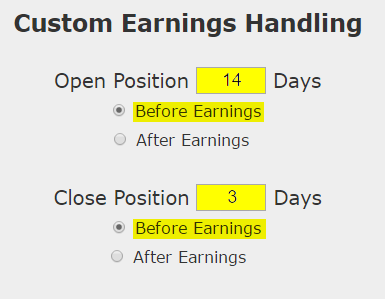
Square next has earnings due out on 2018-02-27 after the market closes, and 14-days before then would be 2-13-2018. The bullish momentum for Square starts 14-days before earnings, but ends 3 days before the event -- which is to say, at times, there has been non-patterned volatility right before earnings that have disrupted this generally bullish trend before the event.
The Options Optimism Trade Before Earnings in Square Inc
Let's look at the results of buying a monthly 40 delta (slightly out of the money) call option in Square Inc two-weeks before earnings (using calendar days) and selling the call 3-days before the earnings announcement.
Here's the set-up in great clarity; again, note that the trade closes before earnings, so this trade does not make a bet on the earnings result.
This is a particularly interesting set-up because it has a shorter holding period than the full 2-week pre-earnings momentum back-tests, which means it's a little less susceptible to those abrupt market sell-offs. It also sees less time decay since it is a 30-day option with only a 12-day holding period.
Here are the results over the last two-years in Square Inc:
The mechanics of the TradeMachine™ are that it uses end of day prices for every back-test entry and exit (every trigger).
We see a 564% return, testing this over the last 8 earnings dates in Square Inc.
Setting Expectations
While this strategy had an overall return of 564%, the trade details keep us in bounds with expectations:
➡ The average percent return per trade was 76.9%.
➡ The average percent return per winning trade was 121.9%.
➡ The average percent return per losing trade was -58.2%.
We note quite explicitly, that the losers here have been sizeable.
We are holding a free webinar to demonstrate strategies that are immune from bear markets: Discover Volatile Market Trading Results -- Become a master, and leave the fear behind.
Checking More Time Periods in Square Inc
Now we can look at just the last year as well:
We're now looking at 513% returns, on 4 winning trades and 0 losing trades. This momentum has been particularity strong over the last year.
➡ The average percent return over the last year per trade was 82.5%.
WHAT HAPPENED
Bull markets tend to create optimism, whether it's deserved or not. To see how to find the best performing historical momentum, technical analysis or non-directional trades for any stock using empirical results rather than guesses, we welcome you to watch this quick demonstration video:
Tap Here to See the Tools at Work
Risk Disclosure
You should read the Characteristics and Risks of Standardized Options.
Past performance is not an indication of future results.
Trading futures and options involves the risk of loss. Please consider carefully whether futures or options are appropriate to your financial situation. Only risk capital should be used when trading futures or options. Investors could lose more than their initial investment.
Past results are not necessarily indicative of future results. The risk of loss in trading can be substantial, carefully consider the inherent risks of such an investment in light of your financial condition.
Please note that the executions and other statistics in this article are hypothetical, and do not reflect the impact, if any, of certain market factors such as liquidity and slippage.
Trading Earnings Optimism With Options in Square Inc
Square Inc (NYSE:SQ) : Trading Earnings Optimism With Options
Date Published: 2018-02-13Author: Ophir Gottlieb
Disclaimer
The results here are provided for general informational purposes, as a convenience to the readers. The materials are not a substitute for obtaining professional advice from a qualified person, firm or corporation.
Preface
It doesn't get a lot of attention, but payment service provider and processor, Square Inc (NYSE:SQ), has been on a tear over the last two-years, up more than 300%.
Within that run, has been a pre-earnings momentum pattern, but this one is a little different than the others we follow and that difference makes in an interesting topic given the recent massive market volatility.
PREMISE
Square next has earnings due out on 2018-02-27 after the market closes, and 14-days before then would be 2-13-2018. The bullish momentum for Square starts 14-days before earnings, but ends 3 days before the event -- which is to say, at times, there has been non-patterned volatility right before earnings that have disrupted this generally bullish trend before the event.
The Options Optimism Trade Before Earnings in Square Inc
Let's look at the results of buying a monthly 40 delta (slightly out of the money) call option in Square Inc two-weeks before earnings (using calendar days) and selling the call 3-days before the earnings announcement.
Here's the set-up in great clarity; again, note that the trade closes before earnings, so this trade does not make a bet on the earnings result.
This is a particularly interesting set-up because it has a shorter holding period than the full 2-week pre-earnings momentum back-tests, which means it's a little less susceptible to those abrupt market sell-offs. It also sees less time decay since it is a 30-day option with only a 12-day holding period.
Here are the results over the last two-years in Square Inc:
The mechanics of the TradeMachine™ are that it uses end of day prices for every back-test entry and exit (every trigger).
Track this trade idea. Get alerted for ticker `SQ` 14 days before earnings
We see a 564% return, testing this over the last 8 earnings dates in Square Inc.
Setting Expectations
While this strategy had an overall return of 564%, the trade details keep us in bounds with expectations:
➡ The average percent return per trade was 76.9%.
➡ The average percent return per winning trade was 121.9%.
➡ The average percent return per losing trade was -58.2%.
We note quite explicitly, that the losers here have been sizeable.
We are holding a free webinar to demonstrate strategies that are immune from bear markets: Discover Volatile Market Trading Results -- Become a master, and leave the fear behind.
Checking More Time Periods in Square Inc
Now we can look at just the last year as well:
We're now looking at 513% returns, on 4 winning trades and 0 losing trades. This momentum has been particularity strong over the last year.
➡ The average percent return over the last year per trade was 82.5%.
WHAT HAPPENED
Bull markets tend to create optimism, whether it's deserved or not. To see how to find the best performing historical momentum, technical analysis or non-directional trades for any stock using empirical results rather than guesses, we welcome you to watch this quick demonstration video:
Tap Here to See the Tools at Work
Risk Disclosure
You should read the Characteristics and Risks of Standardized Options.
Past performance is not an indication of future results.
Trading futures and options involves the risk of loss. Please consider carefully whether futures or options are appropriate to your financial situation. Only risk capital should be used when trading futures or options. Investors could lose more than their initial investment.
Past results are not necessarily indicative of future results. The risk of loss in trading can be substantial, carefully consider the inherent risks of such an investment in light of your financial condition.
Please note that the executions and other statistics in this article are hypothetical, and do not reflect the impact, if any, of certain market factors such as liquidity and slippage.