Teva- Pharmaceutical Industries Ltd. - ADR
XNYS:TEVA
35.32
+0.80
(+2.32%)
7:47:35 PM EDT: $35.10 -0.22 (-0.62%)


Teva Pharmaceutical Industries Limited, TEVA, earnings, seven, before, stock
Preface
With the market's direction becoming tenuous, we can explore option trading opportunities in Teva Pharmaceutical Industries Limited (NYSE:TEVA) that do not rely on stock direction.
Teva stock is down hard today, trading at $16.26, down 13.58% as of this writing after the FDA approved Mylan's (MYL) generic version of Teva Pharmaceutical's (TEVA) blockbuster drug for multiple sclerosis.
This added volatility could be a welcomed pre-amble to Teva's pre-earnings move. It turns out, over the long-run, for stocks with certain tendencies like Teva Pharmaceutical Industries Limited, there is a clever way to trade market anxiety or market optimism before earnings announcements with options.
This approach has returned 247% with a total holding period of just 48 days in Teva.
According to our data provider, Wall Street Horizon, Teva has earnings due out 11-2-2017 before the market opens. 7 days before 11-2 is 10-26.
Discovery
We found this back-test using the TradeMachine™ scanner, looking for pre-earnings straddles within the S&P 500.

We then adjusted the back-test which by default looks six-days before earnings, and moved it to seven days because the results were better.
The Trade Before Earnings
What a trader wants to do is to see the results of buying an at the money straddle a week before earnings, and then sell that straddle just before earnings. Here is the setup:
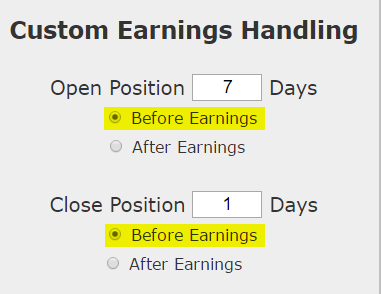
We are testing opening the position 7 calendar days before earnings and then closing the position 1 day before earnings. This is not making any earnings bet. This is not making any stock direction bet.
Once we apply that simple rule to our back-test, we run it on an at-the-money straddle:
Returns
If we did this long at-the-money (also called '50-delta') straddle in Teva Pharmaceutical Industries Limited (NYSE:TEVA) over the last two-years but only held it before earnings we get these results:
Tap Here to See the Back-test
We see a 247% return, testing this over the last 12 earnings dates in Teva Pharmaceutical Industries Limited. That's a total of just 48 days (6 days for each earnings date, over 8 earnings dates).
We can also see that this strategy hasn't been a winner all the time, rather it has won 7 times and lost 1 time, for a 87.5% win-rate
Setting Expectations
While this strategy has an overall return of 247%, the trade details keep us in bounds with expectations:
➡ The average percent return per trade was 34.6% over six-days.
➡ The average percent return per winning trade was 40.2% over six-days.
➡ The percent return for the losing trade was -4.3% over six-days.
WHAT HAPPENED
This is it -- this is how people profit from the option market -- finding trading opportunities that avoid earnings risk and work equally well during a bull or bear market.
To see how to do this for any stock we welcome you to watch this quick demonstration video:
Tap Here to See the Tools at Work
Thanks for reading.
Risk Disclosure
You should read the Characteristics and Risks of Standardized Options.
Past performance is not an indication of future results.
Trading futures and options involves the risk of loss. Please consider carefully whether futures or options are appropriate to your financial situation. Only risk capital should be used when trading futures or options. Investors could lose more than their initial investment.
Past results are not necessarily indicative of future results. The risk of loss in trading can be substantial, carefully consider the inherent risks of such an investment in light of your financial condition.
Please note that the executions and other statistics in this article are hypothetical, and do not reflect the impact, if any, of certain market factors such as liquidity and slippage.
Teva Pharmaceutical Stock Drop and Pre-earnings Option Set-up
Teva Pharmaceutical Industries Limited (NYSE:TEVA) : Avoid Bear Market Risk: The Secret to Option Trading Before Earnings
Date Published: 2017-10-4Author: Ophir Gottlieb
Preface
With the market's direction becoming tenuous, we can explore option trading opportunities in Teva Pharmaceutical Industries Limited (NYSE:TEVA) that do not rely on stock direction.
Teva stock is down hard today, trading at $16.26, down 13.58% as of this writing after the FDA approved Mylan's (MYL) generic version of Teva Pharmaceutical's (TEVA) blockbuster drug for multiple sclerosis.
This added volatility could be a welcomed pre-amble to Teva's pre-earnings move. It turns out, over the long-run, for stocks with certain tendencies like Teva Pharmaceutical Industries Limited, there is a clever way to trade market anxiety or market optimism before earnings announcements with options.
This approach has returned 247% with a total holding period of just 48 days in Teva.
According to our data provider, Wall Street Horizon, Teva has earnings due out 11-2-2017 before the market opens. 7 days before 11-2 is 10-26.
Discovery
We found this back-test using the TradeMachine™ scanner, looking for pre-earnings straddles within the S&P 500.
We then adjusted the back-test which by default looks six-days before earnings, and moved it to seven days because the results were better.
The Trade Before Earnings
What a trader wants to do is to see the results of buying an at the money straddle a week before earnings, and then sell that straddle just before earnings. Here is the setup:
We are testing opening the position 7 calendar days before earnings and then closing the position 1 day before earnings. This is not making any earnings bet. This is not making any stock direction bet.
Once we apply that simple rule to our back-test, we run it on an at-the-money straddle:
Returns
If we did this long at-the-money (also called '50-delta') straddle in Teva Pharmaceutical Industries Limited (NYSE:TEVA) over the last two-years but only held it before earnings we get these results:
| TEVA Long At-the-Money Straddle |
|||
| % Wins: | 87.5% | ||
| Wins: 7 | Losses: 1 | ||
| % Return: | 247% | ||
Tap Here to See the Back-test
We see a 247% return, testing this over the last 12 earnings dates in Teva Pharmaceutical Industries Limited. That's a total of just 48 days (6 days for each earnings date, over 8 earnings dates).
We can also see that this strategy hasn't been a winner all the time, rather it has won 7 times and lost 1 time, for a 87.5% win-rate
Setting Expectations
While this strategy has an overall return of 247%, the trade details keep us in bounds with expectations:
➡ The average percent return per trade was 34.6% over six-days.
➡ The average percent return per winning trade was 40.2% over six-days.
➡ The percent return for the losing trade was -4.3% over six-days.
WHAT HAPPENED
This is it -- this is how people profit from the option market -- finding trading opportunities that avoid earnings risk and work equally well during a bull or bear market.
To see how to do this for any stock we welcome you to watch this quick demonstration video:
Tap Here to See the Tools at Work
Thanks for reading.
Risk Disclosure
You should read the Characteristics and Risks of Standardized Options.
Past performance is not an indication of future results.
Trading futures and options involves the risk of loss. Please consider carefully whether futures or options are appropriate to your financial situation. Only risk capital should be used when trading futures or options. Investors could lose more than their initial investment.
Past results are not necessarily indicative of future results. The risk of loss in trading can be substantial, carefully consider the inherent risks of such an investment in light of your financial condition.
Please note that the executions and other statistics in this article are hypothetical, and do not reflect the impact, if any, of certain market factors such as liquidity and slippage.