Tesla Inc


Why Tesla Risk is Absolutely Huge
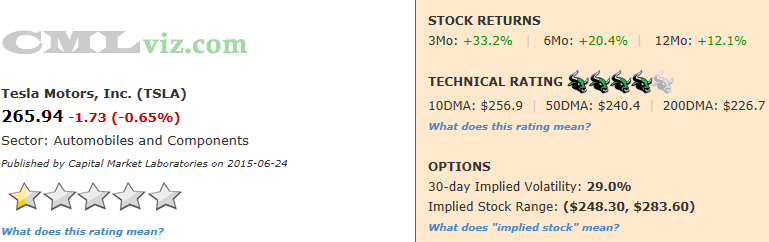
Fundamentals Technicals | Support: 250.38 | Resistance: 282.11 
The risk surrounding Tesla, both upside and downside may be unlike any other firm in the world that isn't a biotech hanging on a cancer drug FDA approval.
The fundamentals surrounding Tesla are awful. Operating margins, net income and free cash flow are essentially collapsing. But sales are exploding and have been for quite some time. I do note that the large tax credit given to Tesla car buyers is soon coming to an end. The 200,000 limit before the tax credit drops dramatically is PER MANUFACTURER it is NOT PER VEHICLE MODEL. Here's a snippet from the IRS website with the yellow highlighting added.

The tax credit drops by 50% once a manufacturer reaches 200,000 unit sales and goes to zero quickly following. I am in no way calling for the end of the world because this tax credit goes away. I simply want to share the knowledge of the rules, that's it. Now, let's move onto more interesting topics.
Tesla has done something that no other firm has been able to do for the last 70 years and that's create a new sustainable US based car manufacturer. But in reality, the firm is so many things. It's a technology company focused in the renewable energy (and battery) space, it's a manufacturer of automobiles and automobile batteries, it's now entering the market of home energy storage and has easily created one of the most recognizable brands in the world. Peers now include FCEL and PLUG aside from Toyota, Ford and GM. If these all "work," this company is worth nowhere near its current market cap. More on the downside in the conclusion.
The next huge "enterprise changing" event for TSLA is the opening of its massive manufacturing facility, aptly named the "Giga-factory" scheduled for 2020. CEO and founder Elon Musk aims to sell 500,000 cars in 2020, up nearly 10-fold from the forecast for 2015, as well as produce millions of home energy storage units (batteries). We note that Elon Musk Says Utilities Shouldn't Fear His Battery Systems. The manufacturing capacity will come from the Giga-factory. The demand for those numbers will have to come from Tesla's success.
![]()
TSLA has a four bull (high rated) technical rating because the stock is trading above its 10-, 50-and 200- day moving averages and even though the stock is down on the day, the 10-day MA is above the 50-day MA (also called a "swing golden cross").
Here are the consensus estimates for next quarter. Note that last quarter's actual result is included at the far right.
| EARNINGS ESTIMATES | |||||
| Earnings Date | EPS | Revenue (Mean) | Revenue (Median) | Last Quarter (Actual) | |
| 2015-07-30 | $-1.39 | $1,119.2 M | $1,117.0 M | $939.9 M | Provided by ZACKS |
Let's look at the core elements that drive the Tesla's fundamental rating.
|
|
|
Fundamentals Rating Summary |
|
|
| METRIC | CURRENT | 1YR AGO | 2YR AGO | DIRECTION |
| Revenue (TTM US$ Millions) | 3,518 | 2,072 | 945 |  |
| Operating Margin (QTR) | 0.902 | 0.93 | 0.99 | FALLING |
| Net Income (TTM US$ Millions) | -398 | -135 | -295 |  |
| Levered Free Cash Flow (TTM US$ Millions) | -1,065 | -102 | -271 | |
| Research and Development (US$ Millions) | 167 | 82 | 55 | |
| Research and Development Expense/Revenue | 0.178 | 0.131 | 0.098 | RISING |

|
|
| Stock Returns and Chart |
|
|
Before we dig into the fundamental trends that drive the rating, let's look at a two-year stock chart with regression channel and 10-day momentum (on the bottom).

Click here to interact with this stock chart
Now let's examine the visualizations of the critical financial measures.
| METRIC | CURRENT | 1YR AGO | 2YR AGO | DIRECTION |
| Revenue (TTM US$ Millions) | 3,518 | 2,072 | 945 | |
Whether you it's tax credits or not, TSLA has seen revenue absolutely explode. Revenue (TTM) has increased for at least five consecutive quarters (10 quarters in this case) which triggers a "trend." In the time series chart below, we can see the consecutive quarter growth.
Now, when a company grows revenue 70% year-over-year, we must recognize the added importance of top-line growth, perhaps even above and beyond earnings, free cash flow and margins. Regardless of the low 0.5 fundamental (star) rating, if revenues continue to explode, everything could follow suit for TSLA. This is as objective and factually true as the poor fundamentals right now.
What do all these numbers mean?
TSLA's fundamental rating benefited these results:
1. The one-year change was positive.
2. The one-year change was greater than +20% (an extra boost to the rating).
3. The two-year change was positive.
Finally, the five+ consecutive quarters of an upward trend in revenue benefited the fundamental (star) rating.
Let's look at Revenue (TTM US$ Millions) in the chart below.

Click Here to Interact With This Chart
| METRIC | CURRENT | 1YR AGO | 2YR AGO | DIRECTION |
| Operating Revenues/Operating Expense | 0.902 | 0.93 | 0.99 | FALLING |
This ratio (which simply represents how much revenue is generated per one dollar of expense) must be at a minimum above 1.0 in order for a company to turn an operating profit. For the latest quarter TSLA showed a ratio of 0.902. Further, the company's all-time high was still $0.99. So in English, the company has never turned a legitimate operating profit, yet. That doesn't mean it's damned, it just means... the company has never turned a legitimate operating profit, yet. i do also note the downward trend, which is unfortunate as sales increase.
What do all these numbers mean?
One year ago Operating Revenues/Operating Expense was 0.93. In the last year we can see operating margins are decreasing and less than 1.0 for the most recent quarter (below the critical level).
TSLA's fundamental rating was affected from the operating margin numbers in the following ways:
1. The current value is below the critical 1.0 level (the firm generates an operating loss).
2. The one-year change was negative (lowers the rating).
Let's look at Operating Revenues/Operating Expense in the chart below with the total assets in the orange line.

Click Here to Interact With This Chart
| METRIC | CURRENT | 1YR AGO | 2YR AGO | DIRECTION |
| Net Income (TTM US$ Millions) | -398 | -135 | -295 | |
Earnings and free cash flow are where this story takes a turn for the worse. Net Income (after tax profit) over the trailing twelve months (TTM) for TSLA is trending lower (again, that's more than five consecutive quarters of worsening losses). For the most recent trailing-twelve-months (TTM) the company reported net income of -$398 million. The company also reported its worst ever quarterly result in its history last quarter (-$154 million). So that's a TTM and quarterly number both at worst levels ever.
In our next chart we plot Net Income (TTM US$ Millions) in the blue bars and the quarterly results in the gold line.

Click Here to Interact With This Chart
| METRIC | CURRENT | 1YR AGO | 2YR AGO | DIRECTION |
| Levered Free Cash Flow (TTM US$ Millions) | -1,065 | -102 | -271 | |
Levered Free Cash Flow (FCF) (TTM US$ Millions) is a critical determinant of stock price since market cap is the present value of all future free cash flows. This is the most disturbing of all measures because the size is starting to get out of control. While a $318 million net loss is ugly, a $1.1 billion trailing-twelve-month FCF is really (really) bad.
This cash metric is down -$794 million from two-years ago.
Again we see a trend (the bad kind), where FCF (TTM US$ Millions) is down for five consecutive quarters. This is quite unusual and has a negative impact on the fundamental rating
For our next chart we plot Levered Free Cash Flow (TTM US$ Millions) in the blue bars through time.

Click Here to Interact With This Chart
| METRIC | CURRENT | 1YR AGO | 2YR AGO | DIRECTION |
| Research and Development (US$ Millions) | 167 | 82 | 55 | |
Tesla is definitely in growth mode. We see that in the revenue and we see that in R&D which is trending higher meaning that for at least five consecutive quarters (seven in this case), it's been rising. R&D is us 105% from last year's value of $82 million and 205% relative to two-years ago ($55 million).
Tesla is spending R&D on its new models, new batteries and a while bunch of other possibly wonderful investments. We haven't included it in this article, but Capital Expenditures (TTM) are totally off the charts exploding. CapEx is up to $1.3 billion in the TTM, up from $348 million a year ago. The company will need cash and the credit line it just received is not enough. Having said that, the company will easiliy raise money with a modest secondary offering.
Let us remember, though, this is planned expense, with a focused purpose and stated goals. That's 500,000 cars sold in the year 2020 with batteries built mostly in the Gigafactory. Elon Musk has been very transparent to all parties that costs are going to start rising huge. There's no monkey business here.
R&D per dollar of revenue for the latest quarter is $0.178. Last year this measure was $0.131 (it's also rising).
In our final time series chart we plot Research and Development (US$ Millions) in the blue bars.

Click Here to Interact With This Chart
Summary
Tesla is one of the most exciting companies on planet Earth with one of the most ground breaking founders on planet Earth. The company is growing revenue and unit sales at huge speed and is only held back (to some degree) by manufacturing capacity. Elon Musk has a defined goal for 2020 and a defined plan on how to get there. That's going to be expensive but the bet is that it's expense that will be turned into assets, revenue and eventually earnings. The bet is also on cheaper models and a model designe to be more attractive to female buyers (Model X).
Now, the fundamentals as of today are atrocious. They just are. I'm not sure there are any other companies in the United States that have a negative free cash flow of over $1 billion that have never turned an operating profit and have trending lower earnings and FCF for several consecutive quarters to all-time lows and the stock is actually up. Tesla is one of a kind in many ways, and this is one.
The company has a market cap of $34 billion as of today (ish). Elon Musk projects a profit by 2020 when the company hits the 500,000 unit sales goal. If the company turns a $1B profit (I just pulled that out of thin air), that's still a mind blowing 34:1 P/E ratio if the stock doesn't move for five years. Toyota trades at a 12:1 P/E. GM trades at 17:1. Ford trades at 19:1. These are just numbers. They are not hard and fast rules nor do they do anything to help us understand the true potential of Tesla's future. But we can say with certainty. While the upside to this company could be remarkable, the risk for TSLA stock if it misses growth projections is absolutely huge.