Tesla Inc


Why Tesla's Earnings and Future Now Abruptly Include Apple
Fundamentals Technicals | Support: 253.01 | Resistance: 282.26 
##Symbol##TSLA
Tesla has earnings due out on Wednesday, August 5th, afer the market closes. While all eyes will focues on the quarterly results (estimates are included below), the real focus will be on forecasts for the rest of the year and, progress on the giga-factory and some sort of discussion on competiton from BMW, General Motors (GM), Ford (F), Nissan (NSANY) and, now brace yourselves, Apple (AAPL).
➜ TSLA generates $0.90 in revenue for every $1 in expense, which is poor and considerably below the sector average of $1.07.
➜ TSLA generates $315,000 in revenue per employee which is above the sector average of $306,000.
Tesla is (not so quietly) creating a secret weapon that could prove to be a colossal competitive advantage in a few years. But, the company has caught Apple's (AAPL) attention; in the bad way. Competition from the biggest of the bigs appears to be right around the corner.
Tesla has done something that no other firm has been able to do for the last 70 years and that's create a new sustainable US based car manufacturer. I do allow for the questioning of the word "sustainable" since Tesla has $1.5 billion in cash and $2.5 billion in debt, let's move passed it. The reality is that Tesla (TSLA) is so many things beyond a car manufacturer. It's a technology company focused in the renewable energy (and battery) space, it's a manufacturer of automobiles and automobile batteries, it's now entering the market of home energy storage and has easily created one of the most recognizable brands in the world.

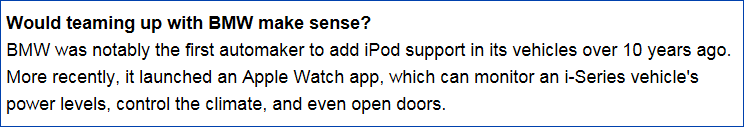
The company also trades at a "genius" premium because Elon Musk is, ya know, alive. But the real barrier to entry that Tesla is creating, which could trump all other competition if scale grows to where the firm is targeting, is something to behold. We'll discuss that soon. There is one huge caveat to the barrier to entry thesis, and that caveat is called Apple (AAPL). News broke on Sunday that Apple may have had meetings with BMW to discuss using the frame of its i3 electric car for its own electric vehicle, according to German publication Manager Magazin (Source: The Motley Fool). Oh, and by the way, BMW makes perfect sense for Apple. Here's a snippet from ther article sourced above.
Tesla has diversified its business with battery storage units and a goal of producing millions of home energy storage units (called Powerwall). Some have seen this move as a massive boon to the profile of the company while others question if it points to a realization that Elon Musk's goal of selling half a million cars in 2020 is simply unreachable. I'm not sure it can't be both, and I'm also not sure if it's either. We note that Elon Musk Says Utilities Shouldn't Fear His Battery Systems, for whatever that's worth.
One thing that has been confused in the media and by analysts is the tax credit given to Tesla car buyers. Those credits are soon coming to an end and the 200,000 unit limit before the tax credit drops dramatically (and finally disappears) is PER MANUFACTURER it is NOT PER VEHICLE MODEL. These are the facts, and they are not disputed. Here's a snippet from the IRS website with the yellow highlighting added.

Here's the bullish argument for Tesla (TSLA):
As the firm adds the Model X (an SUV) to its line-up (which is one car right now) later this year and the Model 3 in 2016, it will have a variety of vehicles that make it more believable that it could reach mass levels of sales. The Model 3 is a sedan with an entry price about half that of the current car. While Tesla sold 31,600 vehicles in 2014, it's looking to sell 500,000 by 2020, and as Elon Musk puts it, "millions" by 2025. In order to do that, the company has started construction on its Gigafactory, and that is the next "enterprise changing" event for the firm. Revenue is exploding higher as are sales. That's the bullish argument and it's a very strong one.
If you're looking for an amazing high stakes game being played out in the real world of financial markets, friends, get out your popcorn, Tesla is your entertainment.
But, while the firm is growing revenue at breakneck speed, the rest of the financials (as of right now) don't look good (actually, they look atrocious). There isn't just execution risk for the firm in terms of actually building the gigafactory and selling half a million cars on a current base of about 50,000 annual sales. There's competitive forces in play that are not trivial, regardless of the "genius" premium. German manufacturers in particular are looking to directly compete with Tesla, and while Tesla has built a fabulous brand name, so have BMW and Audi for premium products. Losses are exploding to new highs (lows?), free cash flow has become a joke at negative $1 billion in the last year and operating margins are dropping.
There's also the very crowded "affordable" EV market with the Nissan Leaf, the Chevy Bolt and soon others to come. We'll get into the details of that as we move forward in this article as well as that barrier to entry I mentioned earlier. But... Don't. Forget. About. Apple (AAPL).

Swing Golden Cross Alert: The short-term 10 day MA is now above the 50 day MA.
TSLA has a four bull (high rated) technical rating because it's trading above both its 50- and 200-day moving averages. We do note that the stock is trading below the short-term 10-day moving average.
I remind all readers that a report just like this one is available for any company for free on CMLviz.com. No e-mail. No login. Free. Forever. Period.
Earnings Estimates
Revenue
Revenue estimates range from $1.03B to $1.26B with an average estimate of $1.17B. Theres is reason to believe Tesla will come in on the high end of revenue based on some demand nd delivery hints we've gotten from other analysts.
EPS
EPS estimates range from -$1.11 to -$0.21, so even the high estimate still projects a loss. The average estimate call sofr earnings per share of -$0.59.
Deliveries
Estimates are for between 10,000 and 11,000 vehicles delivered and expected guidance is for over 13,000 vehicles for the following quarter. In order for the company to reach its 2015 full year guidance, Tesla will need to sell over 33,000 vehicles in the last two quarters which is about as many cars as it sold in all of 2014. That's growth, baby.
Further, the Model X is finally scheduled to be sold and delivered at the end of next quarter.
Now, let's look at the core elements that drive the company's fundamental rating.
|
|
|
Fundamentals Rating Summary |
|
|
| METRIC | CURRENT | 1YR AGO | 2YR AGO | DIRECTION |
| Revenue (TTM US$ Millions) | 3,518 | 2,072 | 945 |  |
| Operating Margin (QTR) | 0.902 | 0.93 | 0.99 | FALLING |
| Net Income (TTM US$ Millions) | -398 | -135 | -295 |  |
| Levered Free Cash Flow (TTM US$ Millions) | -1,065 | -102 | -271 | |
| Capital Expenditures (TTM US$ Millions) | 1,255 | 348 | 242 | |
|
|
| Stock Returns and Chart |
|
|
Before we dig into the fundamental trends that drive the rating, let's look at a two-year stock chart with regression channel and 10-day momentum (on the bottom).

Click here to interact with this stock chart
Now let's examine the visualizations of the critical financial measures.

| METRIC | CURRENT | 1YR AGO | 2YR AGO | DIRECTION |
| Revenue (TTM US$ Millions) | 3,518 | 2,072 | 945 |  |
Revenue (TTM) has increased for at least five consecutive quarters which triggers a "trend." In this case the trend is ten consecutive quarters of new al-time high sin revenue (TTM). When a company grows revenue 70% year-over-year, we must recognize the added importance of top-line growth, perhaps even above and beyond earnings, free cash flow and margins. Regardless of the low 0.5 fundamental (star) rating, if revenues continue to explode, everything could follow suit for TSLA. That's the bet, it's reasonable, but risky.
What do all these numbers mean?
TSLA's fundamental rating benefited these results:
1. The one-year change was positive.
2. The one-year change was greater than +20% (an extra boost to the rating).
3. The two-year change was positive.
Finally, the five+ consecutive quarters of an upward trend in revenue benefited the fundamental (star) rating.
Let's look at Revenue (TTM US$ Millions) in the chart below.

Click Here to Interact With This Chart
| METRIC | CURRENT | 1YR AGO | 2YR AGO | DIRECTION |
| Operating Revenues/Operating Expense | 0.902 | 0.93 | 0.99 | FALLING |
This ratio (which simply represents how much revenue is generated per one dollar of expense) must be at a minimum above 1.0 in order for a company to turn an operating profit. For the latest quarter TSLA showed a ratio of 0.90 and as I discussed at the top of the article, the sector averages $1.07 in revenue per dollar of expense, so fully $0.17 more than Tesla is achieving and perhaps more importantly, the $0.90 means Tesla loses more money per dollar of revenue (losses widen as sales grow). Now there's simply no doubt that the gigafactory economies of scale argument is sound if Tesla can hit 500,000 unit sales by 2020. In other words, operating margins could flip to greater than $1 and in fact be at the top of the sector if all goes according to plan.
What do all these numbers mean?
One year ago Operating Revenues/Operating Expense was 0.93. In the last year we can see operating margins are decreasing and less than 1.0 for the most recent quarter (below the critical level).
TSLA's fundamental rating was affected from the operating margin numbers in the following ways:
1. The current value is below the critical 1.0 level (the firm generates an operating loss).
2. The one-year change was negative (lowers the rating).
Let's look at Operating Revenues/Operating Expense in the chart below with the total assets in the orange line.

Click Here to Interact With This Chart
| METRIC | CURRENT | 1YR AGO | 2YR AGO | DIRECTION |
| Net Income (TTM US$ Millions) | -398 | -135 | -295 | |
Net Income (after tax profit) over the trailing twelve months (TTM) for TSLA is falling and "trending lower". In fact, now both the trailing-twelve-month and quarterly losses stand at massive all-time lows. That chart below is real. It's based on fact. It's objective. No more; no less.
In our next chart we plot Net Income (TTM US$ Millions) in the blue bars and the quarterly results in the gold line.

Click Here to Interact With This Chart
| METRIC | CURRENT | 1YR AGO | 2YR AGO | DIRECTION |
| Levered Free Cash Flow (TTM US$ Millions) | -1,065 | -102 | -271 | |
Levered Free Cash Flow (TTM US$ Millions) is a critical determinant of stock price since market cap is the present value of all future free cash flows. For TSLA the metric is utterly collapsing, has fallen for five consecutive quarters and the last three have been all-time lows. The company currently sits on a trailing-twelve-month $1.1 billion loss in free cash flow. This is quite unusual and has a substantially negative impact on the fundamental rating.
Now before we go nuts here, let's remember that a huge part of this negative FCF is due to the massive investment in the gigafactory, which is supposed to be simply and enormous winner.
For our next chart we plot Levered Free Cash Flow (TTM US$ Millions) in the blue bars through time. Note the falling bars from a year ago (four quarters ago).

Click Here to Interact With This Chart

| METRIC | CURRENT | 1YR AGO | 2YR AGO | DIRECTION |
| Capital Expenditures (TTM US$ Millions) | 1,255 | 348 | 242 | |
Capital Expenditures (CapEx) (TTM US$ Millions) is trending higher meaning that for at least five consecutive quarters, it's been rising, and in this case it's been seven consecutive quarters. CapEx is up 261% in the last year and 418% in the last two-years. Yeah, those are real numbers. Interestingly, in the trailing-twelve-months, CapEx is just under $1.3 billion, nearly exactly the level of negative free cash flow. So, it's not a wonder why cash flow is imploding, in fact, it's happening on purpose.
In our final time series chart we plot Capital Expenditures (TTM US$ Millions) in the blue bars and the green bar which represents the all-time high.

Click Here to Interact With This Chart
Summary
So there we have it. Tesla's revenue is exploding higher as are capital expenditures. The company has its sights set on a massive scale company on the automobile side, and possibly on the battery storage side as well. In fact, if you're looking for a truly unmatched barrier to entry and competitive advantage for Tesla, it is the gigafactory. No other firm has one. No other firm is building one. And if Elon Musk is right, no other firm will be able to catch up once it's built and successful. There is simply no way for any other manufacturer to produce batteries (and therefore electric vehicles) at that scale. Tesla's high end product has huge demand, with the caveat that sometimes high end products have high demand simply because they are high end (especially in a booming economy where the top 1% are reaping all the benefits), but that risk aside, the company could find success outside of the $70,000 car realm with its new models.
But, if Apple (AAPL) does team with BMW for the i3 chasis (which is very common in the car manufacturing business), Apple has the money, brand, technology and scale to out build, out market, out brand and out sell Tesla.
Regardless of Apple, which at this point must be pushed off to the side for now, if Tesla is wrong about its scalablility, and it builds a multi-billion factory and capacity but has no orders to utilize it, the firm is, in the simplest terms, ruined. Tesla is a bet, and whichever side of this argument has compelled you the most gives you an investment thesis (which might simply be, no trade at all). But if you're looking for an amazingly high stakes game being played out in the real world of financial markets, friends, get out your popcorn, Tesla is your entertainment and Apple (AAPL) may be the ever powerful and compelling antagonist.
Follow @OphirGottlieb