Symbol not found
:TWTR 00:00AM GMT
0.00
0.00
(0.00%)


Twitter Inc, TWTR, bullish, options, TTM Technical Squeeze, call

Disclaimer
The results here are provided for general informational purposes, as a convenience to the readers. The materials are not a substitute for obtaining professional advice from a qualified person, firm or corporation.
Preface
This story could feel a little uncomfortable, not in that it's complex, it's actually quite easy, but sometimes it's just not easy to read how an information asymmetry can be the difference between the top 0.1% and everyone else.
But we're here to tear down those walls, so here we go.
Note: This functionality will made available in the CML Trade Machine™ Pro by the end of October, 2017. It is not available at the time of this publication (10-24-2017).
ANSWERS
Technical analysis is the rage nowadays -- from mainstream media news to fintech social media. But the question we all need answered is, 'has this actually worked?' And if so, when has it worked? Which indicator has worked? Which stocks have worked? We are going to answers these questions -- and the answers will be empirical and explicit.
LEDE
This has nothing to do with earnings timing. This is a different type of trade and opens the Trade Machine™ community up to a variety of trades that can work as hedges during a bull or bear market. For example, finding bearish set-ups during a bull market to offset bullish trades.
This is one of the those remarkable few times where in the midst of a bull market we can see that Twitter Inc (NYSE:TWTR) stock is actually down -58.55% over the last three-years. Yet, in that same time frame, using a bullish technical signal on a stock that has dropped has actually shown substantial positive historical returns of 135.2% in the face of a stock down trend.
Here is the all-time stock chart for Twitter (blue line) and the Nasdaq Composite (green line) for context:
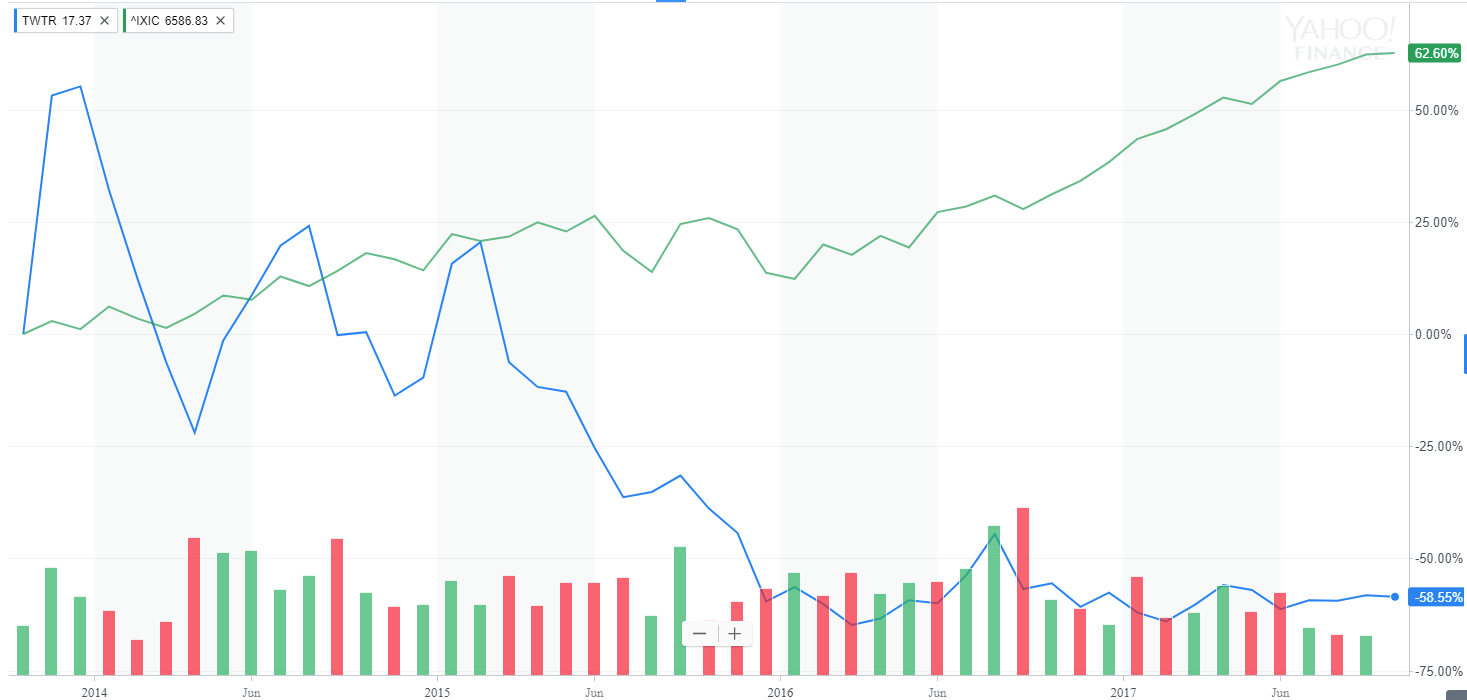
We can see the wild dichotomy.
This is a technical analysis triggered momentum trade that bets on a bullish move in the underlying stock for a period that starts one-day after Twitter Inc (NYSE:TWTR) triggers a breakout from the TTM Squeeze signal and lasts until two-days in a row show reversed (bearish) momentum. It has been a winner for the last 3 years. We note the use of strict risk controls in this analysis.
We include a link to a full and thorough discussion of this technical indicator at the end of this dossier -- no back-test makes any sense without understanding the building blocks, so we present those at the finale of this note.
Twitter Inc (NYSE:TWTR) TTM Squeeze Technical Trigger
In Twitter Inc, using this specific and well defined technical signal has shown quite strong historical results. The idea is simple -- stocks tend to move in tight ranges for the majority of the time, and then they move in bursts for the remaining periods. The TTM Squeeze attempts to find these periods of bursts.
Simply owning deep in the money calls blindly is just an excessively risky bullish bet, but hand-picking the times through technical analysis is what we're after -- that is, empirical and explicit historical pattern recognition. We can test this approach without bias with a custom option back-test.
Rules
* Open the long 90 delta call one day after the bullish TTM Squeeze has been triggered.
* Close the call after that signal has seen a consecutive two-day reversal.
* Use the options closest to 30 days from expiration.
* Never trade earnings -- irrespective of the technical indicator, this trade will close 2-days before a scheduled earnings announcement.
This is a straight down the middle bullish bet -- this trade wins if the stock rises and will lose if the stock does not.
RISK CONTROL
Since owning deep in the money options is an aggressive directional bet, we test this approach with added risk limiting parameters, namely, the back-test uses a 40% stop loss and a 40% limit gain.
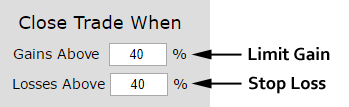
In English, at the close of every trading day, if the call option is up 40% from the price at the start of the trade, it gets sold for a profit. If it is down 40%, it gets sold for a loss. This also has the benefit of taking profits early, before the TTM squeeze signal ends -- that is, before two consecutive reversal days appear.
RESULTS
Owning the 90-delta call in Twitter Inc (NYSE:TWTR) over the last three-years but only held it after a TTM Squeeze was triggered we get these results:
The mechanics of the TradeMachine™ are that it uses end of day prices for every back-test entry and exit (every trigger).
We see a 135.2% back-test return, which is based on 9 trades in Twitter Inc while the stock itself is down over 58%. The bullish TTM Squeeze is a technical signal that doesn't happen often, but rather is designed to mechanically identify the times when a stock may move out of a low volatility period and thrust higher. It's a signal based on probabilities, so it won't work all the time but it's historical success can be measured empirically.
RETURN CHART
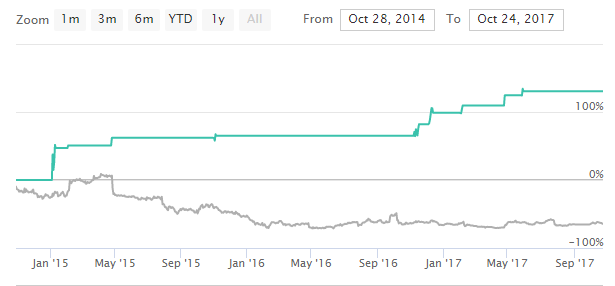
At the top of this dossier we showed Twitter's stock performance relative to the NASDAQ Composite. Below we show the returns of this technical back-test using options (blue line) compared to the stock (gray line).
Looking at Averages
The overall return was 135.2%; but the trade statistics tell us more with average trade results:
➡ The average return per trade was 17.99%.
Looking at the Last Year
While we just looked at a multi-year back-test, we can also hone in on the most recent year with the same test:
Now we see a 54.1% return over the last year and a 100% win-rate.
➡ The average return for the last year per trade was 16.85%.
Technical Details
For the details about the TTM Squeeze, how it works, when it's triggered and what it means, you can read our dossier The details behind the TTM Squeeze Technical Indicator .
WHAT HAPPENED
This is one way people profit from the option market. Take a reasonable idea or hypothesis, test it, and apply lessons learned. To see how to test this for any stock we welcome you to watch this quick demonstration video:
Tap Here to See the Tools at Work
Risk Disclosure
You should read the Characteristics and Risks of Standardized Options.
Past performance is not an indication of future results.
Trading futures and options involves the risk of loss. Please consider carefully whether futures or options are appropriate to your financial situation. Only risk capital should be used when trading futures or options. Investors could lose more than their initial investment.
Past results are not necessarily indicative of future results. The risk of loss in trading can be substantial, carefully consider the inherent risks of such an investment in light of your financial condition.
Please note that the executions and other statistics in this article are hypothetical, and do not reflect the impact, if any, of certain market factors such as liquidity and slippage.
Answers: The Breathtaking Reality of Technical Analysis With Options in Twitter
Twitter Inc (NYSE:TWTR) : The Bullish Technical TTM Squeeze With Options
Date Published: 2017-10-24Author: Ophir Gottlieb
Disclaimer
The results here are provided for general informational purposes, as a convenience to the readers. The materials are not a substitute for obtaining professional advice from a qualified person, firm or corporation.
Preface
This story could feel a little uncomfortable, not in that it's complex, it's actually quite easy, but sometimes it's just not easy to read how an information asymmetry can be the difference between the top 0.1% and everyone else.
But we're here to tear down those walls, so here we go.
Note: This functionality will made available in the CML Trade Machine™ Pro by the end of October, 2017. It is not available at the time of this publication (10-24-2017).
ANSWERS
Technical analysis is the rage nowadays -- from mainstream media news to fintech social media. But the question we all need answered is, 'has this actually worked?' And if so, when has it worked? Which indicator has worked? Which stocks have worked? We are going to answers these questions -- and the answers will be empirical and explicit.
LEDE
This has nothing to do with earnings timing. This is a different type of trade and opens the Trade Machine™ community up to a variety of trades that can work as hedges during a bull or bear market. For example, finding bearish set-ups during a bull market to offset bullish trades.
This is one of the those remarkable few times where in the midst of a bull market we can see that Twitter Inc (NYSE:TWTR) stock is actually down -58.55% over the last three-years. Yet, in that same time frame, using a bullish technical signal on a stock that has dropped has actually shown substantial positive historical returns of 135.2% in the face of a stock down trend.
Here is the all-time stock chart for Twitter (blue line) and the Nasdaq Composite (green line) for context:
We can see the wild dichotomy.
This is a technical analysis triggered momentum trade that bets on a bullish move in the underlying stock for a period that starts one-day after Twitter Inc (NYSE:TWTR) triggers a breakout from the TTM Squeeze signal and lasts until two-days in a row show reversed (bearish) momentum. It has been a winner for the last 3 years. We note the use of strict risk controls in this analysis.
We include a link to a full and thorough discussion of this technical indicator at the end of this dossier -- no back-test makes any sense without understanding the building blocks, so we present those at the finale of this note.
Twitter Inc (NYSE:TWTR) TTM Squeeze Technical Trigger
In Twitter Inc, using this specific and well defined technical signal has shown quite strong historical results. The idea is simple -- stocks tend to move in tight ranges for the majority of the time, and then they move in bursts for the remaining periods. The TTM Squeeze attempts to find these periods of bursts.
Simply owning deep in the money calls blindly is just an excessively risky bullish bet, but hand-picking the times through technical analysis is what we're after -- that is, empirical and explicit historical pattern recognition. We can test this approach without bias with a custom option back-test.
Rules
* Open the long 90 delta call one day after the bullish TTM Squeeze has been triggered.
* Close the call after that signal has seen a consecutive two-day reversal.
* Use the options closest to 30 days from expiration.
* Never trade earnings -- irrespective of the technical indicator, this trade will close 2-days before a scheduled earnings announcement.
This is a straight down the middle bullish bet -- this trade wins if the stock rises and will lose if the stock does not.
RISK CONTROL
Since owning deep in the money options is an aggressive directional bet, we test this approach with added risk limiting parameters, namely, the back-test uses a 40% stop loss and a 40% limit gain.
In English, at the close of every trading day, if the call option is up 40% from the price at the start of the trade, it gets sold for a profit. If it is down 40%, it gets sold for a loss. This also has the benefit of taking profits early, before the TTM squeeze signal ends -- that is, before two consecutive reversal days appear.
RESULTS
Owning the 90-delta call in Twitter Inc (NYSE:TWTR) over the last three-years but only held it after a TTM Squeeze was triggered we get these results:
| TWTR: Long 90 Delta Call
Signal: TTM Technical Squeeze |
|||
| % Wins: | 100% | ||
| Wins: 9 | Losses: 0 | ||
| % Return: | 135.2% | ||
The mechanics of the TradeMachine™ are that it uses end of day prices for every back-test entry and exit (every trigger).
We see a 135.2% back-test return, which is based on 9 trades in Twitter Inc while the stock itself is down over 58%. The bullish TTM Squeeze is a technical signal that doesn't happen often, but rather is designed to mechanically identify the times when a stock may move out of a low volatility period and thrust higher. It's a signal based on probabilities, so it won't work all the time but it's historical success can be measured empirically.
RETURN CHART
At the top of this dossier we showed Twitter's stock performance relative to the NASDAQ Composite. Below we show the returns of this technical back-test using options (blue line) compared to the stock (gray line).
Looking at Averages
The overall return was 135.2%; but the trade statistics tell us more with average trade results:
➡ The average return per trade was 17.99%.
Looking at the Last Year
While we just looked at a multi-year back-test, we can also hone in on the most recent year with the same test:
| TWTR: Long 90 Delta Call
Signal: TTM Technical Squeeze |
|||
| % Wins: | 100% | ||
| Wins: 4 | Losses: 0 | ||
| % Return: | 54.1% | ||
Now we see a 54.1% return over the last year and a 100% win-rate.
➡ The average return for the last year per trade was 16.85%.
Technical Details
For the details about the TTM Squeeze, how it works, when it's triggered and what it means, you can read our dossier The details behind the TTM Squeeze Technical Indicator .
WHAT HAPPENED
This is one way people profit from the option market. Take a reasonable idea or hypothesis, test it, and apply lessons learned. To see how to test this for any stock we welcome you to watch this quick demonstration video:
Tap Here to See the Tools at Work
Risk Disclosure
You should read the Characteristics and Risks of Standardized Options.
Past performance is not an indication of future results.
Trading futures and options involves the risk of loss. Please consider carefully whether futures or options are appropriate to your financial situation. Only risk capital should be used when trading futures or options. Investors could lose more than their initial investment.
Past results are not necessarily indicative of future results. The risk of loss in trading can be substantial, carefully consider the inherent risks of such an investment in light of your financial condition.
Please note that the executions and other statistics in this article are hypothetical, and do not reflect the impact, if any, of certain market factors such as liquidity and slippage.