Workday Inc - Ordinary Shares - Class A
XNAS:WDAY 4:00:00 PM EDT
135.40
+5.13
(+3.94%)
7:56:58 PM EDT: $135.05 -0.35 (-0.26%)


Workday Inc, WDAY, earnings, option, return, swing, short-term

Preface
There is a pattern of bullish momentum in Workday Inc (NYSE:WDAY) stock just days before earnings, and we can track that by looking at swing returns in the option market.
This is a short-term swing trade, it won't be a winner forever, and it can be easily derailed by a couple of down days in the market irrespective of Workday Inc news, but for now it has shown a repeating success that has not only returned 108% over the last 2-years in just 16 days of trading, but has also shown a win-rate of 87.5%, which means 7 wins and only 1 loss in the last two-years.
DISCOVERY
Pre-earnings momentum trades have been particularly profitable of late, with Trade Machine members seeing wins in GOOGL, MAR, NVDA, MOMO, LRCX and AVGO. But the real question has become -- not why they work -- which we address below, but how to find the best opportunities.
Here is a snapshot of the Trade Machine scanner, to be released in our webinar on August 30th. This is a scan for:
* Length: Two-years
* Trade: 3-day pre-earnings momentum
* Population: Largest 500 companies by market cap
* Sorted by: Win-rate.
Here are the results:
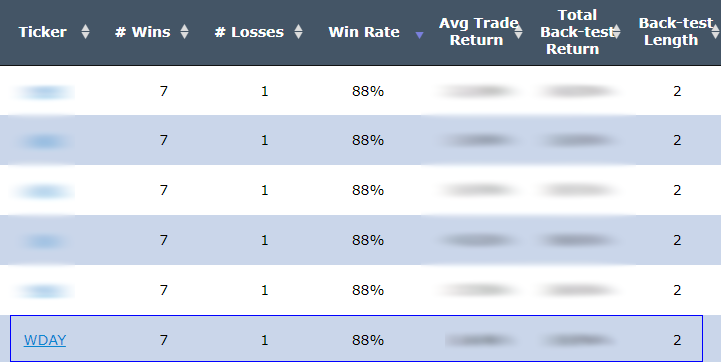
We can see there are only a handful of companies that have the highest win-rate, 87.5%, and Workday is one.
According to the Workday Investor relations site,, it will hold its next earnings conference call on Wednesday, August 30, 2017, 5:00 pm EDT. Three days before August 30th would be Sunday August 27th, so that would actually be Monday August 28th for the Trade machine calculations.
IDEA
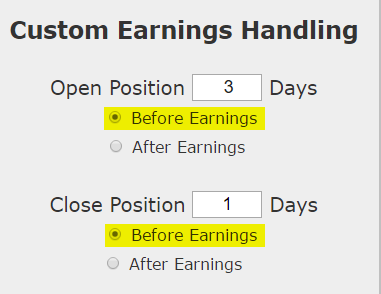
The idea is quite simple -- trying to take advantage of a pattern in short-term bullishness just before earnings, and then getting out of the way so no actual earnings risk is taken. We will examine the outcome of going long a weekly call option in Workday Inc just three calendar days before earnings and selling the call one day before the actual news.
This is construct of the trade, noting that the short-term trade closes before earnings and therefore does not take a position on the earnings result.
Often times we look at option set-ups that are longer-term, and take no directional bet -- this is not one of those times. This is a no holds barred short-term bullish swing trade with options and that's it. It's a bullish bet, so must be conscious of the delta risk.
RISK MANAGEMENT
We can add another layer of risk management to the back-test by instituting and 40% stop loss and a 40% limit gain. Here is that setting:
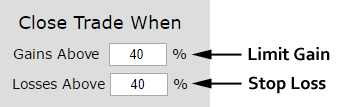
In English, at the close of each trading day we check to see if the long option is either up or down 40% relative to the open price. If it was, the trade was closed.
RESULTS
Below we present the back-test stats over the last two-years in Workday Inc:
Tap Here to See the Back-test
We see a 108% return, testing this over the last 8 earnings dates in Workday Inc. That's a total of just 16 days (2-day holding period for each earnings date, over 8 earnings dates).
This short-term trade hasn't won every time, and it won't, but it has been a winner 7 times and lost 7 time, for a 87.5% win-rate
Setting Expectations
While this strategy has an overall return of 169.9%, the trade details keep us in bounds with expectations:
➡ The average percent return per trade was 18.3% over two-days.
➡ The average percent return per winning trade was 27.3% over two-days.
➡ The percent return for the losing trade was -44.3% over two-days.
Looking at More Recent History
We did a multi-year back-test above, now we can look at just the last year:
We're now looking at 56% returns, on 4 winning trades and 0 losing trades.
➡ The average percent return over the last year per trade was 12.8% over two-days.
If you like what you're reading, learn more about scientific option trading in a free webinar we are holding:

Discover the power of applying science to your options trading in a free webinar:
Discover Scientific Options Trading
WHAT HAPPENED
Bull markets tend to create optimism, whether it's deserved or not. This has been a tradable phenomenon in Ambarella. To see how to test this for any stock we welcome you to watch this quick demonstration video:
Tap Here to See the Tools at Work
Risk Disclosure
You should read the Characteristics and Risks of Standardized Options.
Past performance is not an indication of future results.
Trading futures and options involves the risk of loss. Please consider carefully whether futures or options are appropriate to your financial situation. Only risk capital should be used when trading futures or options. Investors could lose more than their initial investment.
Past results are not necessarily indicative of future results. The risk of loss in trading can be substantial, carefully consider the inherent risks of such an investment in light of your financial condition.
Swing Trading Earnings Bullish Momentum With Options in Workday Inc
Workday Inc (NYSE:WDAY) : Swing Trading Earnings Bullish Momentum With Options
Date Published: 2017-08-25Author: Ophir Gottlieb
Preface
There is a pattern of bullish momentum in Workday Inc (NYSE:WDAY) stock just days before earnings, and we can track that by looking at swing returns in the option market.
This is a short-term swing trade, it won't be a winner forever, and it can be easily derailed by a couple of down days in the market irrespective of Workday Inc news, but for now it has shown a repeating success that has not only returned 108% over the last 2-years in just 16 days of trading, but has also shown a win-rate of 87.5%, which means 7 wins and only 1 loss in the last two-years.
DISCOVERY
Pre-earnings momentum trades have been particularly profitable of late, with Trade Machine members seeing wins in GOOGL, MAR, NVDA, MOMO, LRCX and AVGO. But the real question has become -- not why they work -- which we address below, but how to find the best opportunities.
Here is a snapshot of the Trade Machine scanner, to be released in our webinar on August 30th. This is a scan for:
* Length: Two-years
* Trade: 3-day pre-earnings momentum
* Population: Largest 500 companies by market cap
* Sorted by: Win-rate.
Here are the results:
We can see there are only a handful of companies that have the highest win-rate, 87.5%, and Workday is one.
According to the Workday Investor relations site,, it will hold its next earnings conference call on Wednesday, August 30, 2017, 5:00 pm EDT. Three days before August 30th would be Sunday August 27th, so that would actually be Monday August 28th for the Trade machine calculations.
IDEA
The idea is quite simple -- trying to take advantage of a pattern in short-term bullishness just before earnings, and then getting out of the way so no actual earnings risk is taken. We will examine the outcome of going long a weekly call option in Workday Inc just three calendar days before earnings and selling the call one day before the actual news.
This is construct of the trade, noting that the short-term trade closes before earnings and therefore does not take a position on the earnings result.
Often times we look at option set-ups that are longer-term, and take no directional bet -- this is not one of those times. This is a no holds barred short-term bullish swing trade with options and that's it. It's a bullish bet, so must be conscious of the delta risk.
RISK MANAGEMENT
We can add another layer of risk management to the back-test by instituting and 40% stop loss and a 40% limit gain. Here is that setting:
In English, at the close of each trading day we check to see if the long option is either up or down 40% relative to the open price. If it was, the trade was closed.
RESULTS
Below we present the back-test stats over the last two-years in Workday Inc:
| WDAY: Long 40 Delta Call | |||
| % Wins: | 87.5% | ||
| Wins: 7 | Losses: 1 | ||
| % Return: | 108% | ||
Tap Here to See the Back-test
We see a 108% return, testing this over the last 8 earnings dates in Workday Inc. That's a total of just 16 days (2-day holding period for each earnings date, over 8 earnings dates).
This short-term trade hasn't won every time, and it won't, but it has been a winner 7 times and lost 7 time, for a 87.5% win-rate
Setting Expectations
While this strategy has an overall return of 169.9%, the trade details keep us in bounds with expectations:
➡ The average percent return per trade was 18.3% over two-days.
➡ The average percent return per winning trade was 27.3% over two-days.
➡ The percent return for the losing trade was -44.3% over two-days.
Looking at More Recent History
We did a multi-year back-test above, now we can look at just the last year:
We're now looking at 56% returns, on 4 winning trades and 0 losing trades.
➡ The average percent return over the last year per trade was 12.8% over two-days.
If you like what you're reading, learn more about scientific option trading in a free webinar we are holding:
Discover the power of applying science to your options trading in a free webinar:
Discover Scientific Options Trading
WHAT HAPPENED
Bull markets tend to create optimism, whether it's deserved or not. This has been a tradable phenomenon in Ambarella. To see how to test this for any stock we welcome you to watch this quick demonstration video:
Tap Here to See the Tools at Work
Risk Disclosure
You should read the Characteristics and Risks of Standardized Options.
Past performance is not an indication of future results.
Trading futures and options involves the risk of loss. Please consider carefully whether futures or options are appropriate to your financial situation. Only risk capital should be used when trading futures or options. Investors could lose more than their initial investment.
Past results are not necessarily indicative of future results. The risk of loss in trading can be substantial, carefully consider the inherent risks of such an investment in light of your financial condition.