What Technical Analysis Is and How to Use Moving Averages
Technical Analysis and Moving Averages
Date Published: 2019-03-20
Technical Analysis, Moving Averages and Backtesting
* The defintion of technical analysis
* Criticisms of this process
* Addressing pattern over-fitting
* The results of rigorous price and trade testing
Definition: Technical Analysis
Technical analysis is the practice of using historical price charts, most commonly stock charts, foreign exchange charts (forex) or commodities charts, to identify patterns in the past and apply them to the future as rules for trading or investing. When a pattern is identified, if it repeats in the future, it can be used as a measure of a security’s price strength or weakness and ultimately as a trade trigger.
Techncial Analysis -- It is a backtest
Since we only have historical data to review, technical analysis is a backtest with the assumption by the investor that a pattern in the past can be extrapolated into the future. It can also been thought of as a pattern recognition search within the confines of the price chart itself.
The most common form of technical analysis
Whatever the security technical analysis is applied to, it is most commonly used for short-term trend finding. However, there is no established rule that prevents technical analysis from being used in long term charts as well.
Unlike fundamental analysis, technical analysis relies strictly on price patterns, sometimes called price trends, and does not use the data from the financial statements or news to make predictions about future price movements.
Analysis Key Points
1. Technical analysis is a trading discipline to evaluate investments, or more accurately, trades. The goal is to identify indicators that have repeated in the past and can signal uptrends or downtrends.
2. The market technician believes, at some level, that historical chart data has some information about the future, namely that patterns in the past will repeat. In those patterns, the technical analyst applies trade triggers, sometimes called signals, to set trading rules.
3.Technical analysis can be used with or without fundamental analysis, but in and of itself, it does not use financial statement data, news stories, or earnings data.
4. Technical analysis is a backtest once the indicator is employed on a new trade and the profit and loss results are measured.
Charting and Applications
* Opponents and proponents of Analysis
Technical analysis has two broad skepticisms. The first surrounds the efficient market hypothesis, which states that market prices, of all securities, reflect all of the known public information and therefore any analysis on this known information cannot lead to excess returns (or 'alpha.') Historical chart data is just one of those pieces, but it is certainly encapsulated in the broad use term "known public information."
The second criticism, which in part implicitly relies on the first, is that a pattern, or series of patterns on one chart, or even a handful of charts, isn’t necessarily evidence of an investment signal that will repeat, but is much more likely a randomly occurring phenomenon. The idea that one pattern in one chart at one time is somehow applicable to several charts of several companies at several different times fails to apply rigor.
While skepticism exists, you will find many successful technical traders with well researched signals. From casual day investors and traders to full time professional traders, the clamor of credulity in technical analysis is hard to ignore.
Technical Analysis – Overcoming the Weaknesses
There are thousands of technical indicators that have proliferated throughout time, and the sheer scale has, understandably, driven higher scrutiny on the veracity of actual pattern recognition through charting rather than an occurrence of random patterns. After all, with enough signals, you can find a pattern in almost anything – but there’s no reason to believe it will repeat, even for that same stock.
Side-stepping Pitfalls of Technical Analysis
In order to side step the most pressing concerns about technical analysis, and the various chart trends it may find, traders can apply a robust backtest of a set of rules on a group of companies and follow the performance through time. The time period should include at least one bull market and one bear market, and if possible, two bear markets bookending a longer-term bull market.
Even further, rather than follow a single security, or even a handful of securities, through time, the backtest should cover a known entity of related companies. Stock indexes are wonderful examples, and an index like the Nasdaq 100, which is a technology stock heavy index, could be an even better fit.
More Price Analysis is Not Always Better Price Analysis
Further, rather than reaching for as many technical indicators as possible and forcing a pattern to fit, a trader can isolate a group of indicators, like moving averages, and test if a robust signal exists. Since moving averages are, arguably, the most used technical indicators, it would make sense to test them, in particular, for veracity of signal. Or, better said, if technical analysis works, then moving averages are as good a placed as any to start testing it.
Trading Technical Analysis Triggers, Price Moving Averages and Backtesting
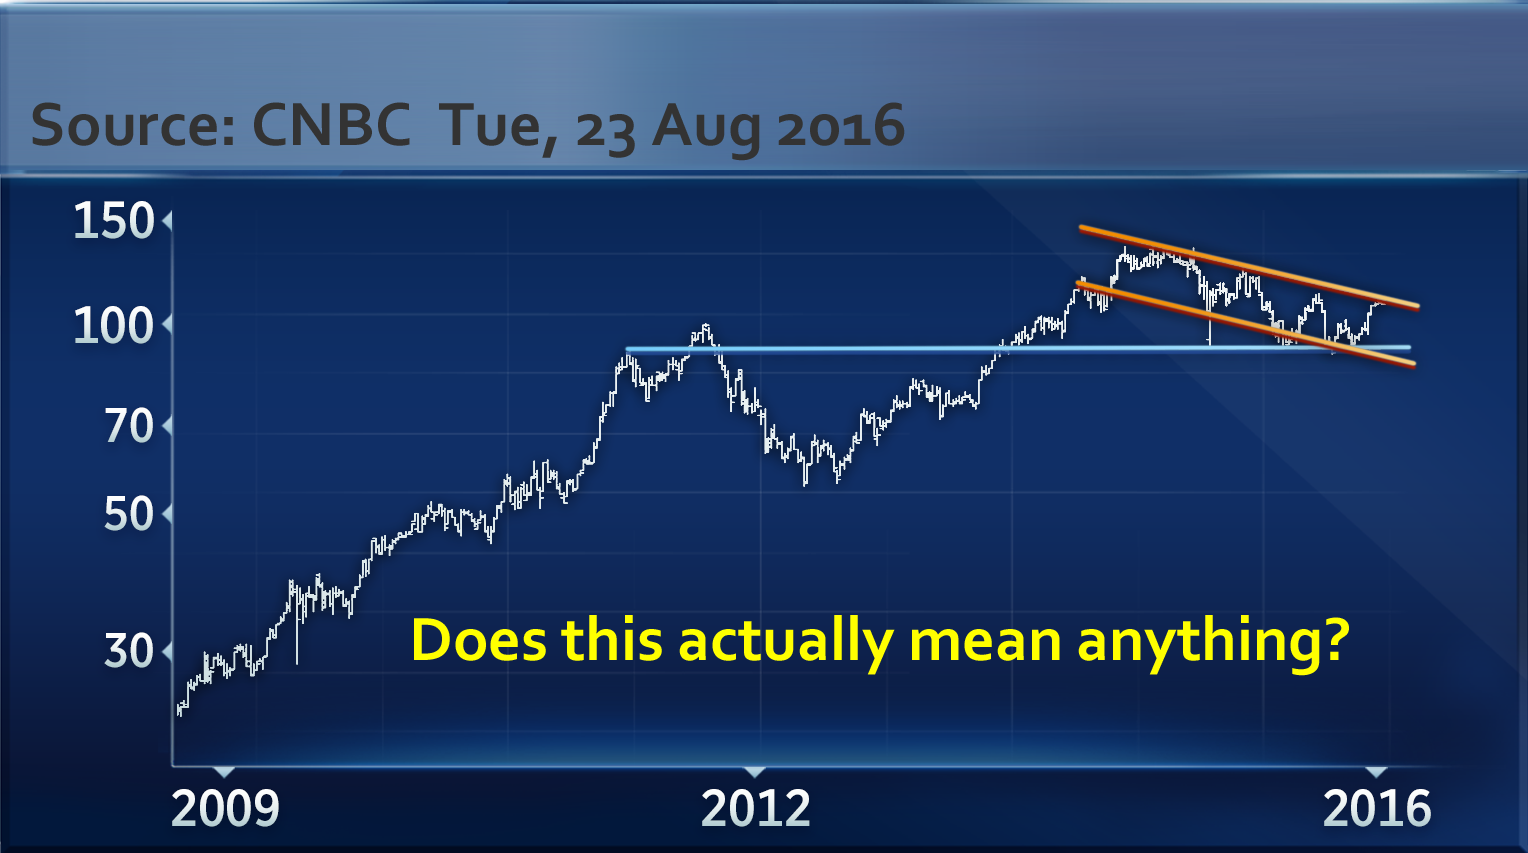
There comes a time when we have to ask ourselves if and when technical analysis adds any value to trading. That is, are we doing more than just drawing lines on a chart?
Capital Market Laboratories has done the rigorous testing, entering the proposition of whether or not technical analysis works unbiased. That is, we let the results stand for themselves. We entered the study with no basis for belief, one way or the other. We had nothing to prove – simply something to discover.
Analysis -- And We Discovered...
It turns out that there is a combination of moving averages, with the relative strength index (RSI), that when tested on the constituents of the Nasdaq 100 from 2009-2019, and from 2007-2009, did significantly outperform the baseline, both with substantially larger average returns per trade, and the win rate per stock.
This time period includes two bear markets, as well as a long-term bull market and the results for this combination of moving averages outperformed in each period -- that is, 2007-2009, 2009-2019, and each sub period of 5-years, 3-yers, 2-years, and 1-year.
This is true of both the bullish combination of indicator and the bearish combination of indicators.
Why This Matters
To learn more about technical analysis and moving averages and applying the results of a robust measure, we encourage you to watch the video demonstration of this phenomenon here:
Make Technical Analysis Successful