7 Stunning Charts That Define Technology's Giants
Fundamentals
PREFACE
Apple (NASDAQ:AAPL), Amazon (NASDAQ:AMZN), Facebook (NASDAQ:FB), Google (NASDAQ:GOOG), Microsoft (NASDAQ:MSFT) and to a certain degree, Netflix (NASDAQ:NFLX), are shaping the trends that will define technology's future.
From smartphones, wearables, streaming video on demand, and online video, to advertising, e-commerce, the cloud, and virtual reality -- it's these companies that will transform the future. Let's examine them in seven charts.
CHART 1: MARKET CAP
Let's start simple: market capitalization.
MARKET CAP
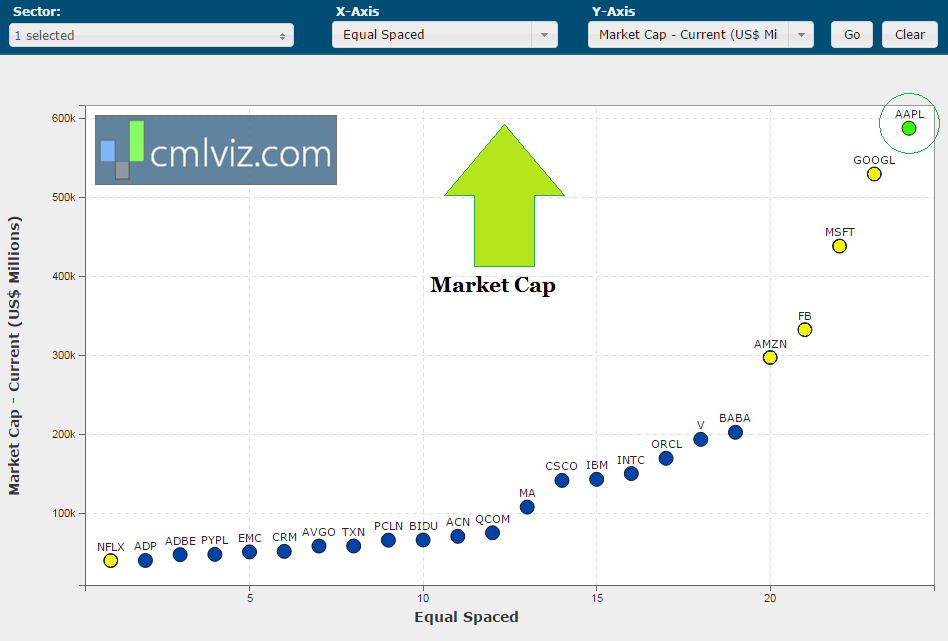

It was once unimaginable to consider a company reaching the one trillion dollar mark in market cap, but both is more than half way there and Google is right behind it. These two mega caps are the most valuable companies in the world in any sector.
CHART 2: REVENUE
Let's look at the revenue generated by these companies in the trailing twelve-months (TTM):
REVENUE (TTM)
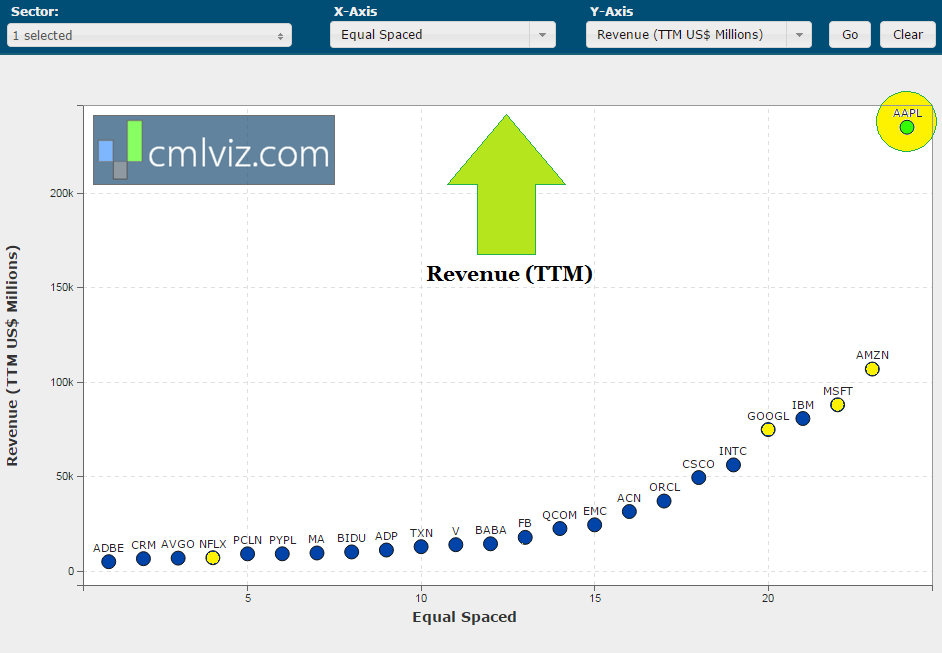

Apple again tops the list with the largest revenue of any technology firm. The surprise may come from Amazon, which comes in at number two and by a rather staggering amount. By the end of 2017, First Call estimates put Amazon at over $150 billion in revenue, which are nearly double Google’s recent results.
We break news every day. Discover the Undiscovered.
Get Our (Free) News Alerts Once a Day.
CHART 3: NET INCOME
Net income is the fancy way of saying "after tax profits."
NET INCOME (TTM)
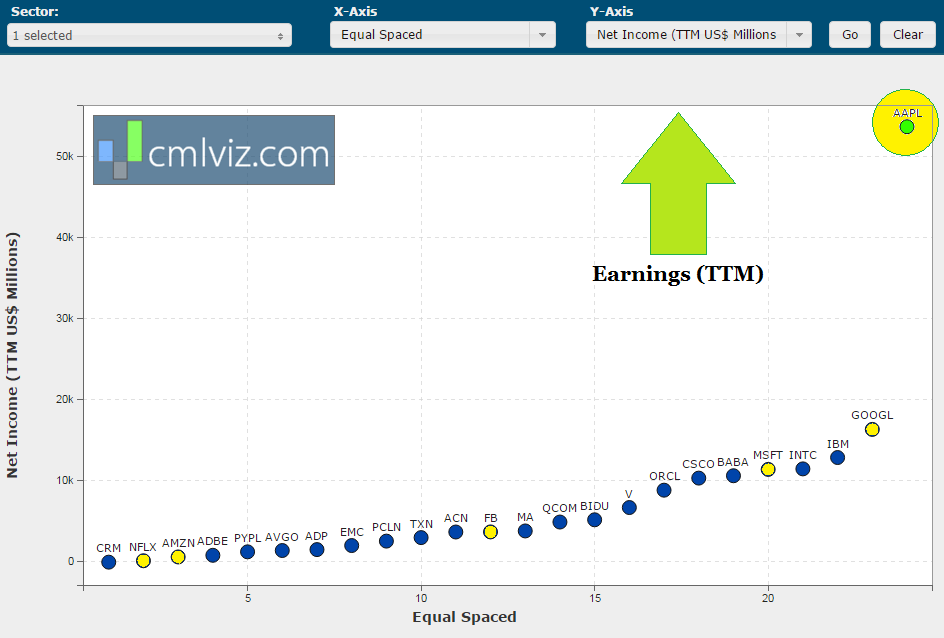

Make it three for three for Apple as the company tops the list again. But this time we see a difference so great that we almost need a separate chart for the rest of the peer group. For all the clamoring by the bears of an Apple descent, let us remember that as of now, no company has ever delivered larger earnings than Apple in a year in any sector, in any country on any exchange.
CHARTS 4 AND 5: RESEARCH & DEVELOPMENT
First, let's look at the raw amount spent on research and development (R&D) in the latest quarter:
R & D
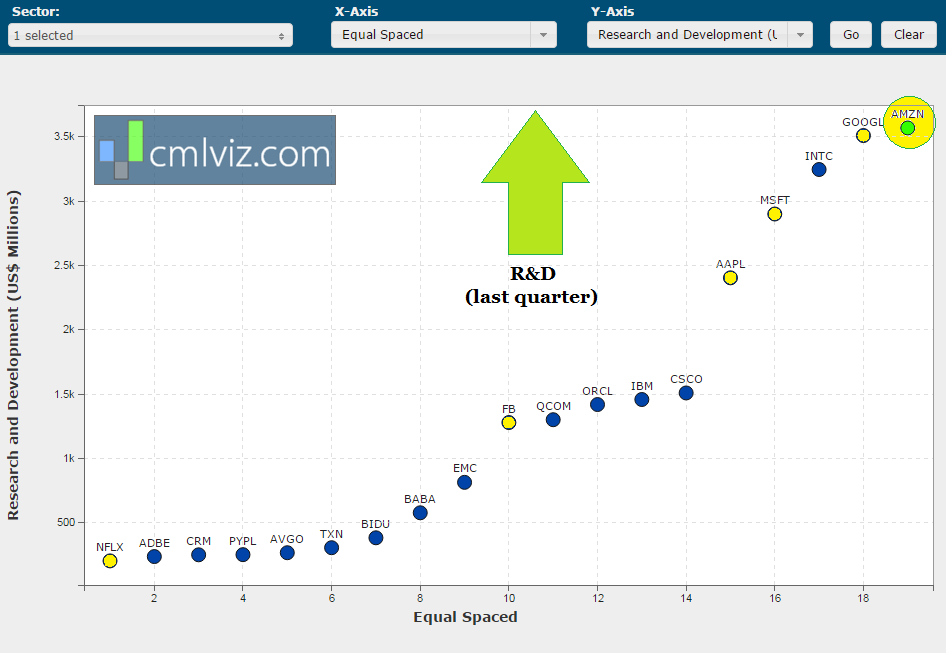

Perhaps it may surprise you, but Amazon is the largest spender on research and development but the headlines often miss this reality. Amazon doesn't list a line item on its income statement as "research and development," but rather lists "technology and content." The mainstream media has missed this so many times it has become an ongoing joke amongst analyst insiders.
Coming in at number two is Alphabet's Google. Note that while Apple is the largest company in tech world by market cap, revenue and earnings -- it is not spending the most on R&D. Having said that, Apple has increased in R&D spending by fully 80% in the last two-years and the innovation coming is breathtaking.
Now let's take a look at R&D again, but this time scale it to size. We look at R&D expense per $1 of operating expense:
R & D per $1 OF EXPENSE
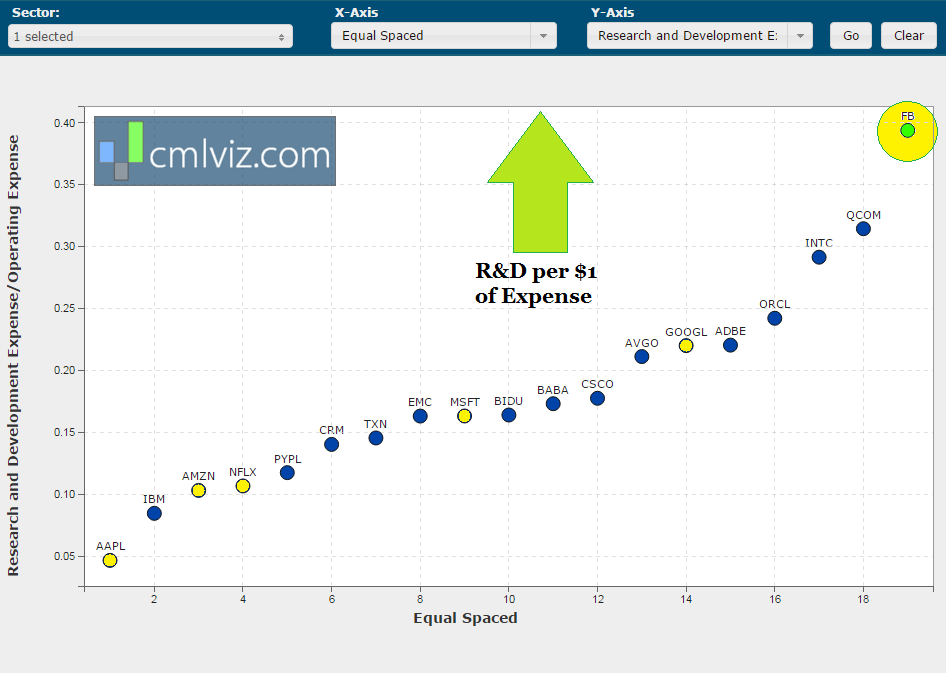

This may be the most fascinating of all the charts. It turns out that Facebook spends more on R&D than any other technology company per $1 of operating expense. We also see that Apple drops all the way to the bottom.
CHART 6: BUYBACKS
The scale of stock buy backs in the recent bull market has been unprecedented. In fact, some analysts believe that nearly 60% of the stock volume on exchanges has been due to company's repurchasing their own stock. That's a frightening reality for those that are looking for a widespread reason to believe buying shows strength in the market.
BUYBACKS
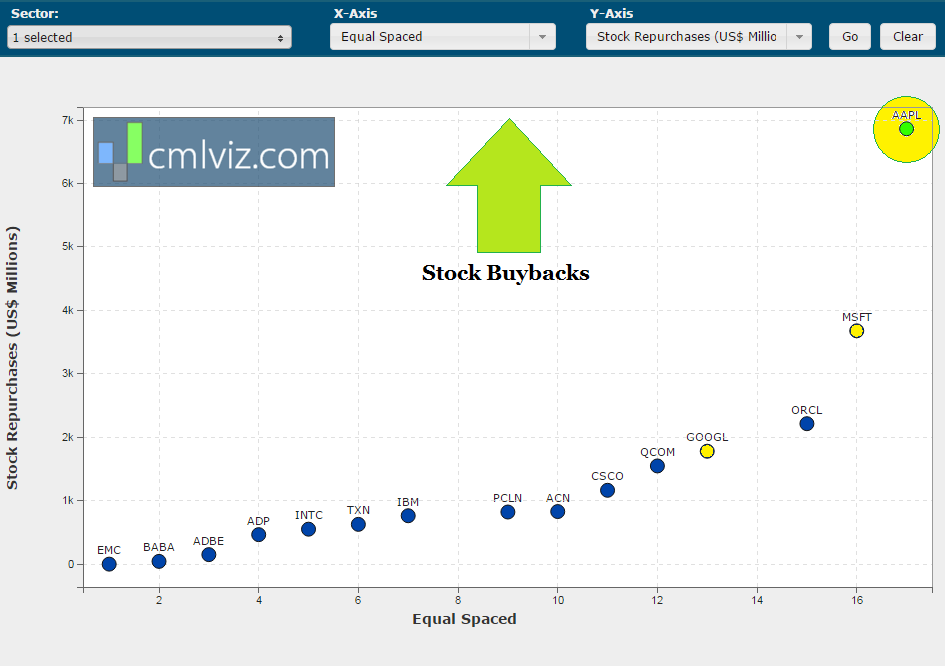

While Apple is one of our favorite companies in the world as an investment, its buyback binge has not only been unprecedented, but worrisome. Apple has purchased more of its stock that the value of Netflix times three over the last few years. It's relieving to see some of that expense now go to R&D, where Apple has turned on the growth engine again.
You'll note that Facebook, Amazon and Netflix aren't on this chart -- those firms have found other places to spend their corporate cash.
CHART 7: PRICE TO SALES
Finally, we can see exactly how the stock market is pricing growth when we look at the price to sales (P/S) comps:
PRICE TO SALES
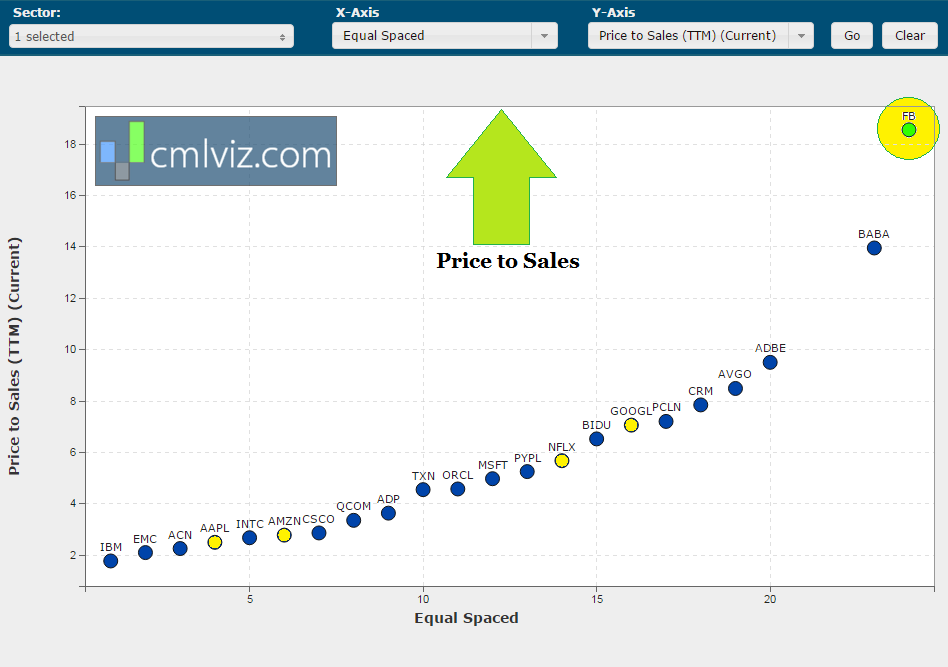

Facebook has earned itself a premium far and above its mega cap peers and that's strictly a reflection of the anticipated growth. If Facebook hits its numbers, the firm will generate well over $33 billion in revenue within two years, nearly a doubling of its latest year.
Of course, the higher the P/S, the higher the expectations, the higher the risk.
WHY THIS MATTERS
Of course this is barely the start of the real analysis. There's so much going on with Apple, FANG and Microsoft it's impossible to cover in one report. But, to find the 'next Apple,' 'next Apple,' or 'next FANG stock,' we have to get ahead of the curve. This is what CML Pro does. Our research sits side-by-side with Goldman Sachs, Morgan Stanley and the rest on professional terminals, but we are the anti-institution and break the information advantage the top .1% have.
Each company in our 'Top Picks' is the single winner in an exploding thematic shift like artificial intelligence, Internet of Things, drones, biotech and more. In fact, here are just two of the trends that will radically affect the future that we are ahead of:
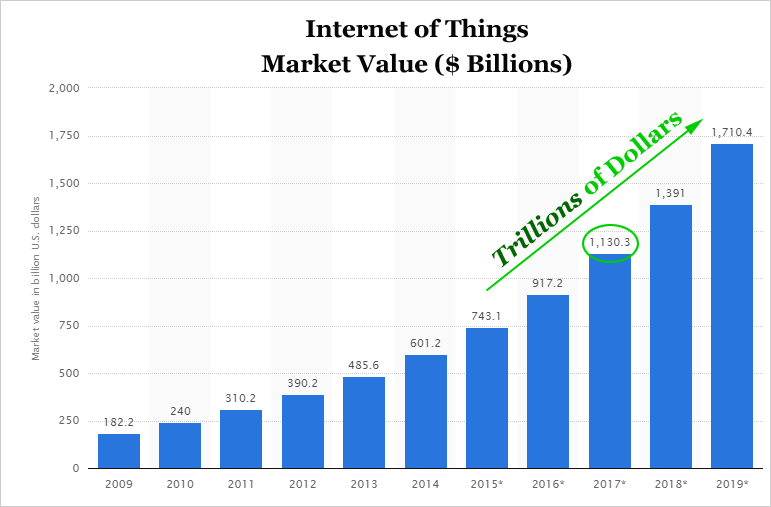
The Internet of Things (IoT) market will be measured in trillions of dollars as of next year. CML Pro has named the top two companies that will benefit. Then there's cyber security:
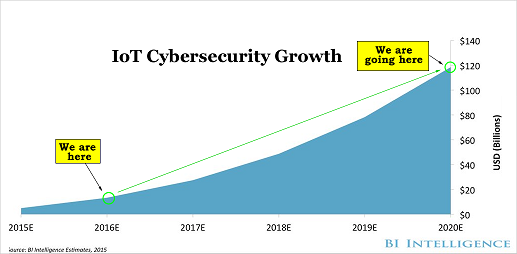
Market correction or not, recession or not, the growth in this area is a near certainty, even if projections come down, this is happening. CML Pro has named the single best cyber security stock to benefit from this theme.
These are just two of the themes we have identified and this is just one of the fantastic reports CML Pro members get along with all the visual tools, the precious few thematic top picks for 2016, research dossiers and alerts. For a limited time we are offering CML Pro at a 90% discount for $10/mo. with a lifetime guaranteed rate. Join Us: Get the most advanced premium research delivered to your inbox along with access to visual tools and data that until now has only been made available to the top 1%.
Thanks for reading, friends.


