


Snap Up Volatility to Avoid Bear Market Risk: The Secret to Option Trading Before Earnings in JD.com Inc

JD.com Inc (NASDAQ:JD) : Avoid Bear Market Risk: The Secret to Option Trading Before Earnings
Date Published: 2018-10-13
Disclaimer
The results here are provided for general informational purposes, as a convenience to the readers. The materials are not a substitute for obtaining professional advice from a qualified person, firm or corporation.Preface
With the market's direction becoming tenuous, and the Chinese giants getting clobbered BABA, BIDU, JD), we can explore option trading opportunities in one of them, the e-commerce giant JD.com Inc (NASDAQ:JD), that does not rely on stock direction.The Trade Before Earnings
What a trader wants to do is to see the results of buying an out of the money strangle (40 delta) a week before earnings (using the options closest to 14 days from expiration), and then sell that strangle just before earnings.Here is the setup:
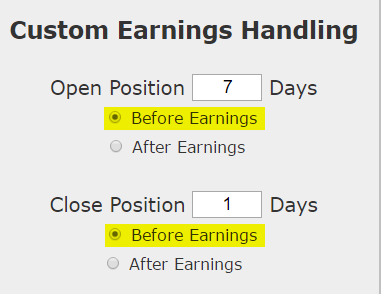
We are testing opening the position 7 calendar days before earnings and then closing the position 1 day before earnings. This is not making any earnings bet. This is not making any stock direction bet.
Once we apply that simple rule to our back-test, we run it on an out-of-the-money strangle:
Returns
If we did this long out-of-the-money (also called '40-delta') strangle in JD.com Inc (NASDAQ:JD) over the last two-years but only held it before earnings we get these results:
| JD Long out-of-the-money strangle |
|||
| % Wins: | 75% | ||
| Wins: 6 | Losses: 2 | ||
| % Return: | 188% | ||
Tap Here to See the Back-test
The mechanics of the TradeMachine® Stock Option Backtester are that it uses end of day prices for every back-test entry and exit (every trigger).
Track this trade idea. Get alerted for ticker `JD` 7 days before earnings
We see a 188% return, testing this over the last 8 earnings dates in JD.com Inc.
Setting Expectations
While this strategy has an overall return of 188%, the trade details keep us in bounds with expectations:➡ The average percent return per trade was 23.6%.
➡ The average percent return per winning trade was 34.1%.
➡ The average percent return per losing trade was -7.7%.
It's the return on the winning trades compared to the negative return on the losing trades that makes this type of back-test so compelling, when combined with the win rate.
WHAT HAPPENED
This is how people profit from the option market. Take a reasonable idea or hypothesis, test it, and apply lessons learned.Tap Here, See for Yourself
Risk Disclosure
You should read the Characteristics and Risks of Standardized Options.
Past performance is not an indication of future results.
Trading futures and options involves the risk of loss. Please consider carefully whether futures or options are appropriate to your financial situation. Only risk capital should be used when trading futures or options. Investors could lose more than their initial investment.
Past results are not necessarily indicative of future results. The risk of loss in trading can be substantial, carefully consider the inherent risks of such an investment in light of your financial condition.
Please note that the executions and other statistics in this article are hypothetical, and do not reflect the impact, if any, of certain market factors such as liquidity and slippage.