


Win Rates First -- Right After Earnings, The Intelligent Options Trade in ServiceNow Inc (NOW)

Win Rates First -- Right After Earnings, The Intelligent Options Trade in ServiceNow Inc (NOW)
Date Published: 2019-04-24
Lede
Sometimes it's the win rate that we're after -- and it takes patience. Today is such a back-test.Preface
This is an option backtest that starts two-days after ServiceNow Inc (NYSE:NOW) earnings and lasts for the one month to follow. We use some technical analysis requirements to bolster the win rate by avoiding times when the stock is in a bearish momentum zone.
Over the 2-, 3-, and 5-year time periods ending on April 10th, 2019, this backtest with the technical and stock return requirements, has shown a 81% win rate for the constituents of the Nasdaq 100. For the year ending April 10th, 2019, the win rate has been 89%.
ServiceNow Inc (NYSE:NOW) Earnings
While the mainstream media likes to focus on the actual earnings move for a stock, that's the distraction when it comes to option trading.
For ServiceNow Inc, if the stock move the day following earnings was up (any amount), and then we waited another trading day after the stock move, and fulfilled a technical requirements, and then sold an one-month out of the money put spread, the results were simply staggering. We use two-days to allow the stock to fully reach equilibrium post earnings.
We can examine this intelligent approach, objectively, with a custom option back-test. Here is our earnings set-up:
Rules
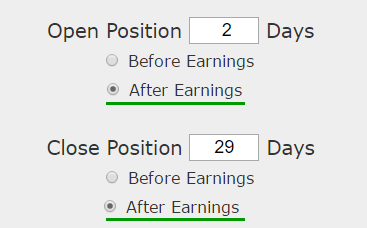
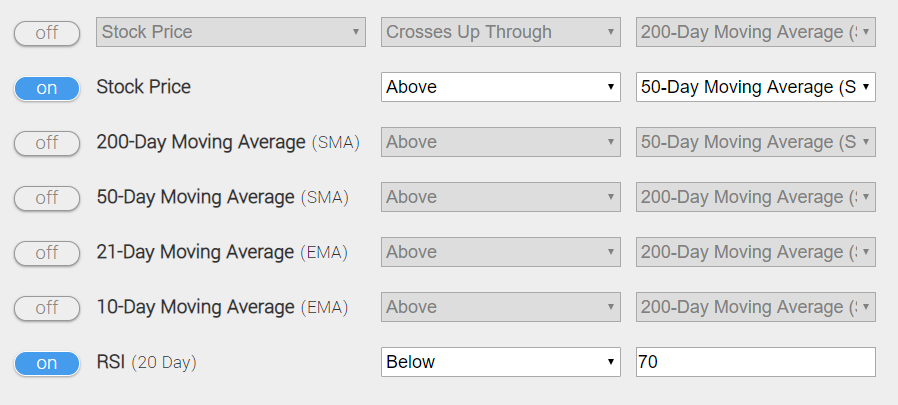
Open short put spread 2-days after earnings if these requirements are met:
* The stock price is above the 50-day simple moving average and the RSI (20-day) is below 70.
* The stock price move the single day after earnings was greater than 0.1%, which essentially means, the stock did not go down the day following earnings.
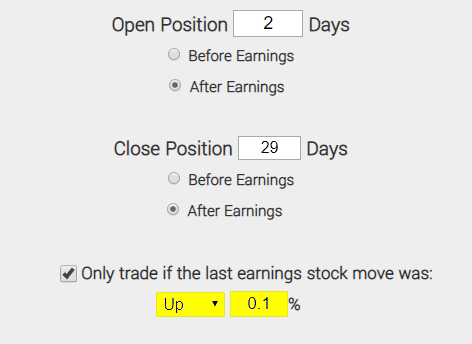
If and only if those requirements are met -- a short-put spread is opened using the 30 delta for the short strike price and the 10 delta for the long strike price.
* Close short put spread 29 calendar days later.
* Use the options closest to 30-days to expiration, but longer than 29 days.
MULTI-YEAR OPTION BACKTEST RETURNS
If we sold this 30/10 delta out-of-the-money put spread with the requirements listed above in ServiceNow Inc (NYSE:NOW) over the last two-years but only held it after earnings we get these results:
| NOW: Short 30 Delta / 10 Delta Put Spread |
|||
| % Wins: | 100% | ||
| Wins: 5 | Losses: 0 | ||
| % Return: | 62.2% | ||
Tap Here to See the Back-test
We see a 62.2% return, testing this over the last 8 earnings dates, which resulted in five triggers in ServiceNow Inc.
Setting Expectations
While this strategy had an overall return of 62.2%, the trade details keep us in bounds with expectations:
➡ The average percent return per trade was 13% in just 27-calendar days.
ONE-YEAR OPTION BACKTESTER RETURNS
If we sold this 30/10 delta out-of-the-money put spread in ServiceNow Inc (NYSE:NOW) over the last year but only held it if and only if the conditions were all met, we see these results:
| NOW: Short 30 Delta / 10 Delta Put Spread |
|||
| % Wins: | 100% | ||
| Wins: 2 | Losses: 0 | ||
| % Return: | 34.7% | ||
Tap Here to See the Back-test
MORE TO IT THAN MEETS THE EYE
While a short put spread is a strategy that gains profits if the underlying stock "doesn't go down a lot," there is more to this with ServiceNow Inc.
What we're after with this approach is identifying companies that make their large stock move the day after earnings -- whether that's up or down -- and after that, find a sense of equilibrium in the stock price for the next month. This is what we find in ServiceNow Inc (NYSE:NOW) .
WHAT HAPPENED
This is it -- this is how people profit from the option market -- it's pattern recognition, not luck. Tap here to learn more.
Risk Disclosure
Past performance is not an indication of future results.
Trading futures and options involves the risk of loss. Please consider carefully whether futures or options are appropriate to your financial situation. Only risk capital should be used when trading futures or options. Investors could lose more than their initial investment.
Past results are not necessarily indicative of future results. The risk of loss in trading can be substantial, carefully consider the inherent risks of such an investment in light of your financial condition.
Please note that the executions and other statistics in this article are hypothetical, and do not reflect the impact, if any, of certain market factors such as liquidity and slippage.
You should read the Characteristics and Risks of Standardized Options.