


Trigger May be Imminent: How to Trade Papa John's International After an Earnings Gap Drop
Papa John's International Inc (NASDAQ:PZZA) : How to Trade Papa John's International Inc After an Earnings Gap Drop
Date Published: 2018-07-16
Disclaimer
The results here are provided for general informational purposes, as a convenience to the readers. The materials are not a substitute for obtaining professional advice from a qualified person, firm or corporation.LEDE
The pizza maker, Papa John's International Inc (NASDAQ:PZZA), has had a rough few weeks, culminating in the ouster of John Schnatter, its founder, Chairman and CEO who is also the largest shareholder, after making racist comments.That could pave the path to confusion over leadership in the near-term, but still, what would be the catalyst to a bearish momentum turn? It turns out, it could be earnings, which are estimated (not confirmed) by Wall Street Horizon to come out on 7-31-2018.
There is a bearish momentum pattern in Papa John's International Inc (NASDAQ:PZZA) stock 1 trading day after earnings, if and only if the stock showed a large gap down after the actual earnings announcement. This back-test was only triggered if the earnings move was a gap down.
This is a conditional entry -- the company reports earnings and if the stock move off of that report is a 3% loss or larger, then a bearish position is back-tested looking for continuing downward momentum. The event is rare, but when it has occurred, the back-test results are noteworthy.
Papa John's International Inc (NASDAQ:PZZA) Earnings
In Papa John's International Inc, if the stock move immediately following an earnings result was a large drop (3% or more to the downside), when we test waiting one-day after that earnings announcement and then bought a three-week at the money (50 delta) put, the results were quite strong.This back-test opens one-day after earnings were announced to try to find a stock that continues a downward spiral after an earnings gap down.
Simply owning options after earnings, blindly, is likely not a good trade, but hand-picking the times and the stocks to do it in can be useful. We can test this approach without bias with a custom option back-test. Here is the timing set-up around earnings:
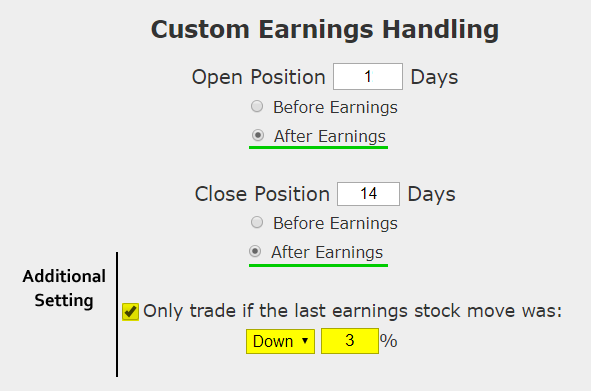
Rules
* Condition: Wait for the one-day stock move off of earnings, and if it shows a 3% loss or more in the underlying, then, follow these rules:* Open the long at-the-money put one-trading day after earnings.
* Close the long put 14 calendar days after earnings.
* Use the options closest to 21 days from expiration (but more than 14 days).
This is a straight down the middle direction trade -- this trade wins if the stock is continues on a downward trajectory after a large earnings move the two-weeks following earnings and it will stand to lose if the stock rises, instead. This is not a silver bullet -- it's a trade that needs to be carefully examined.
But, this is a conditional back-test, which is to say, it only triggers if an event before it occurs.
RISK CONTROL
Since blindly owning put can be a quick way to lose in the option market, we will apply a tight risk control to this analysis as well. We will add a 40% stop loss and a 40% limit gain.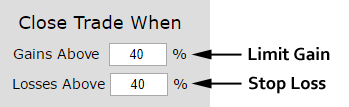
In English, at the close of every trading day, if the put is up 40% from the price at the start of the trade, it gets sold for a profit. If it is down 40%, it gets sold for a loss. This also has the benefit of taking profits if there is a stock decline early in the two-week period rather than waiting to close 14-days later.
Another risk reducing move we made was to use 21-day options and only hold them for 14-days so the trade doesn't suffer from total premium decay.
RESULTS
If we bought the at-the-money put in Papa John's International Inc (NASDAQ:PZZA) over the last two-years but only held it after earnings and after an earnings pop higher, we get these results:
The mechanics of the TradeMachine® Stock Option Backtester are that it uses end of day prices for every back-test entry and exit (every trigger).
Track this trade idea. Get alerted for ticker `PZZA` 1 days after earnings
Looking at Averages
The overall return was 305%; but the trade statistics tell us more with average trade results:➡ The average return per trade was 114.3% over each 13-day period.
DISCOVERY
We identified this back-test result quickly and easily by scanning across "all tickers" and looking at the "1 Day After Earnings Drop, Long Put" scan.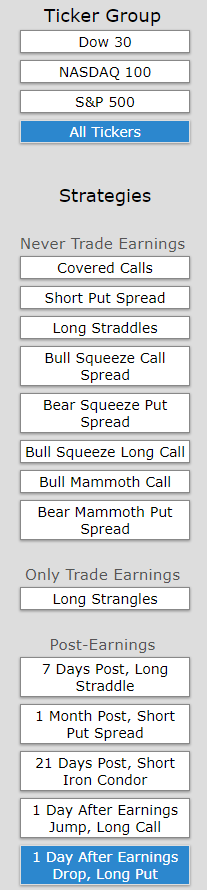
MORE RECENT HISTORY
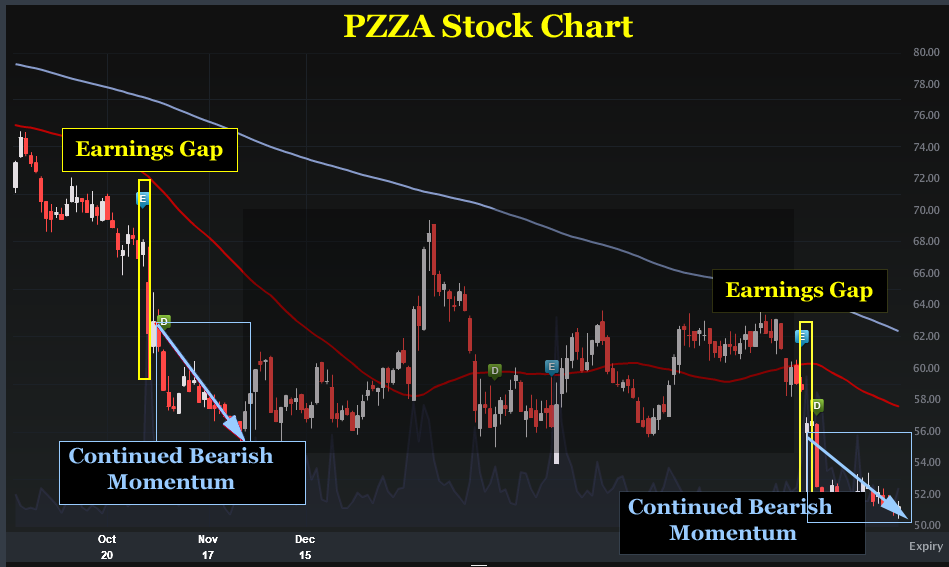
We can even look at just the past year and see this event was triggered twice. Here are those results:Here's a stock chart with the earnings gaps down and the following bearish momentum highlighted:
WHAT HAPPENED
You can guess stock direction -- guess momentum -- guess anything. Or, you can be empirical. But there's a lot less luck to successful option trading than that -- and every professional trader knows it. To learn more watch this quick demonstration video -- the first 70 seconds alone could change your view of trading, forever:Tap Here to See the Tools at Work
Risk Disclosure
You should read the Characteristics and Risks of Standardized Options.
Past performance is not an indication of future results.
Trading futures and options involves the risk of loss. Please consider carefully whether futures or options are appropriate to your financial situation. Only risk capital should be used when trading futures or options. Investors could lose more than their initial investment.
Past results are not necessarily indicative of future results. The risk of loss in trading can be substantial, carefully consider the inherent risks of such an investment in light of your financial condition.
Please note that the executions and other statistics in this article are hypothetical, and do not reflect the impact, if any, of certain market factors such as liquidity and slippage.