


When to Jump on a Technical Reversal to Get Bullish Momentum in Apple Inc
When to Jump on a Technical Reversal to Get Bullish Momentum in Apple Inc
Date Published: 2019-06-04
Disclaimer
The results here are provided for general informational purposes from the CMLviz Trade Machine Stock Option Backtester as a convenience to the readers. The materials are not a substitute for obtaining professional advice from a qualified person, firm or corporation.Lede
It's time to recognize a new pattern in this choppy market. Let's do it.When the market takes a spill, it has been a repeating pattern that some of the larger companies have turned around at specific points and a bullish trigger emerges from the fear and selling. Today we look at exactly that pattern and exactly that trigger in Apple.
We will, in particular, focus on a period when a stock is in technical failure but may be emerging out of it. This is called a technical reversal.
Preface
Technical analysis is the most common form of financial back-testing. It does, at every step, use historical patterns in order to extrapolate them into the future.Charting isn't simply a collection of a few trend charts, or a few indicators that work in one example. No matter how many lines and chart patterns are drawn on it, is not a rigorous backtest -- it's just a chart, at one specific time -- it really is.
That's why technical analysis can feel so close to being profitable for a trader, and we can do so much preparation work, but at the same time the results, well, they never quite match up to the expectation.
TESTING SWING TRADING SIGNALS - OPTION BACKTESTER LOGIC WITH TECHNICAL ANALYSIS
The goal is to create a portfolio of option trading backtests with alerts attached to them, so we don't have to stare at the screen all day, but rather use Trade Machine as the pattern recognition work horse to notify when the ideas become actionable.The Bullish Option Trade with Technical Analysis and Moving Averages in Apple Inc (NYSE:AAPL)
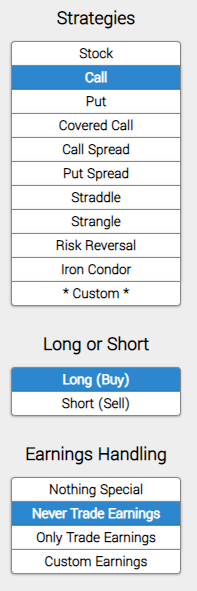
Today we focus specifically on the times when a stock has been pushed down from selling and look for that moment -- that trigger, that indicates the selling pressure has eased and the stock may be ready for a bounce.We examine the result of a long out-of-the-money (strike price is set to the 40 delta) call option, in call options that are the closest to 30-days from expiration (using calendar days). But we follow three rules to test the swing trade:
* Never Trade Earnings
That means the backtester never opens a trade between the "black out period" of two before through two-days after an earnings announcement.Here it is, first, we enter the long call.
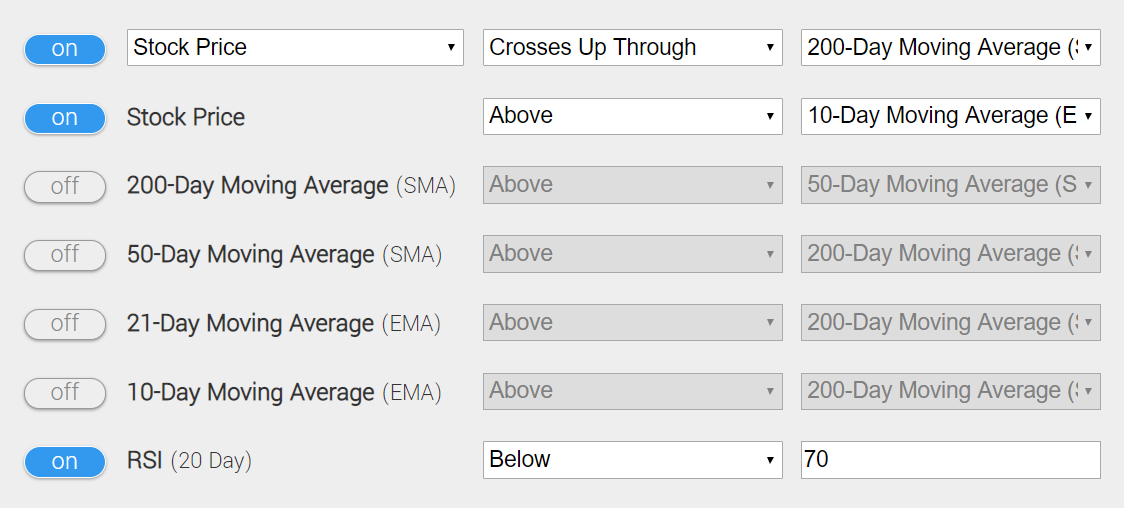
* Use a technical analysis trigger to start the trade, if and only if these specific items are met. This is the trading system:
* Trigger on the precise day that the stock crosses the 200-day simple moving average (SMA) -- that's a trigger of a momentum breakout right at that moment -- an uptrend in a stock that has been in technical failure before.
* The stock is already above the 10-day exponential moving average (EMA), which means that the stock has already shown some short-term recovery momentum.
* The Relative Strength Index (RSI), using 20-days, is below 70, so the stock isn't overbought -- there is little risk of being oversold with the prior signals in place.
Here it is in an image from Trade Machine -- only focus on the moving average and RSI settings where the filter is turned to "on.":
You can set an alert in Trade Machine®, which will track all of these moving parts for you, and message you when it triggers. In fact, you can do this with a portfolio of stocks for a portfolio of bullish and bearish triggers. Let Trade Machine do the work for you -- there's no need to stare at the screen.
* Finally, we set a very specific type of stop loss and limit:
* Use a 50% limit gain and a 50% stop loss.
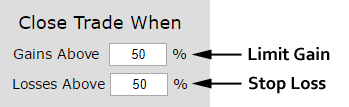
At the end of each day, the back-tester checks to see if the long call option is up 50% or down 50%. If it is, it closes the position. Since the back-tester waits until the end of the day, you can see gains (and losses) that far exceed the stop and limit parameters. That is a reflection of the reality of option trading, rather than a theoretical backtesting approach.
10-year Stock Option Backtester With Technical Analysis Results in Apple Inc
Here are the results over the last ten-years:
| AAPL: Long 40 Delta Call | |||
| % Wins: | 71.4%% | ||
| Wins: 5 | Losses: 2 | ||
| % Return: | 460% | ||
Tap Here to See the Back-test
➡ The average percent return over the last year per trade was 68.8% for each 30-day period.
Stock Option Backtester With Technical Analysis Results
Here are the results over the last two-years in Apple Inc:| AAPL: Long 40 Delta Call | |||
| % Wins: | 100% | ||
| Wins: 2 | Losses: 0 | ||
| % Return: | 199% | ||
Tap Here to See the Back-test
The mechanics of the TradeMachine® are that it uses end of day prices for every back-test entry and exit (every trigger).
This is not a magic bullet, rather it's a bullish technical analysis momentum strategy predicated on using pattern recognition in charts through moving averages and RSI, rather than manually drawling lines stock by stock.
Setting Expectations
While this strategy had an overall return of 199%, the trade details keep us in bounds with expectations:➡ The average percent return per trade was 103.5%% for each 30-day period.
Checking the Moving Averages
You can check to see the values of all the moving averages discussed above with real-time daily prices, including live after hours prices, for AAPL by viewing the Pivot Points tab on www.CMLviz.com.Next Steps
You can do this for any stock and use probabilities to enhance trade discovery. Tap here to use technical analysis with pattern recognition. Stop guessing.Risk Disclosure
Past performance is not an indication of future results.
Trading futures and options involves the risk of loss. Please consider carefully whether futures or options are appropriate to your financial situation. Only risk capital should be used when trading futures or options. Investors could lose more than their initial investment.
Past results are not necessarily indicative of future results. The risk of loss in trading can be substantial, carefully consider the inherent risks of such an investment in light of your financial condition.
Please note that the executions and other statistics in this article are hypothetical, and do not reflect the impact, if any, of certain market factors such as liquidity and slippage.
You should read the Characteristics and Risks of Standardized Options.